Table of Contents
Background
I found this survey on Alex The Analyst’s YouTube video.
At that time, I was just interested in analysing data.
Later, I began practicing research report writing and used this report as a basis.
Executive Summary
The data industry continues to expand at an unprecedented pace. With businesses across industries relying on analytics for decision-making, data professionals have become some of the most in-demand talent in the global workforce.
This survey of 630 participants provides a snapshot of who today’s data professionals are, how they entered the field, what tools they use, and what they value in their careers.
Key highlights:
- Gender gap remains wide: 74% of respondents are male.
- Career switchers dominate: Nearly 6 in 10 professionals entered data from another field.
- Python leads programming: 420 professionals selected it as their favorite language.
- Job satisfaction is mixed: Coworkers and work-life balance score highest, salary and mobility lowest.
- Pay disparities persist: The U.S. is the top-paying country, with a significant gender wage gap of around 75%.
- Top motivation for new jobs: Better pay, followed by remote work and work-life balance.
This report unpacks these findings, providing insights into the current state of the profession and what lies ahead.
1. Introduction
The rise of big data, artificial intelligence, and digital transformation has reshaped industries worldwide. Companies now view data not just as a support function but as a strategic asset. Against this backdrop, we surveyed 630 data professionals to better understand:
- Who are they (demographics and education)?
- How did they enter the profession?
- What languages do they use?
- How satisfied are they with their jobs?
- What motivates them to seek new opportunities?
2. Who Took the Survey?
2.1 Demographics
- Participants: 630
- Professions represented: 80
- Mean age: 30
 |
2.2 Age Breakdown
The largest age group in the survey was 25 years old, followed by professionals aged 26, 28, 23, and 30.
This highlights the youthful nature of the data community, with a majority in their mid-20s to early 30s.
 |
2.3 Gender Gap
The gender imbalance remains a defining feature of the field:
- Male: 74.29% (468 participants)
- Female: 25.71% (162 participants)
While women are entering data careers, the numbers remain significantly lower compared to men — a challenge the industry must address through targeted training, inclusive hiring, and mentorship programs.
 |
2.4 Geographic Reach
Participants represented multiple countries, with the largest group coming from:
- United States: 261
- India and the United Kingdom followed next in representation.
- This reflects both the maturity of the U.S. data market and the rapid growth of data careers in emerging economies.

2.5 Education Levels
Education remains a key gateway into the field:
- Bachelor’s degree: 329 participants
- Master’s degree: 192
- PhD: 5
- Others included High School (36) and Associate’s (16).
- This suggests that while advanced education helps, a bachelor’s degree is the most common entry point into data careers.

3. Career Pathways
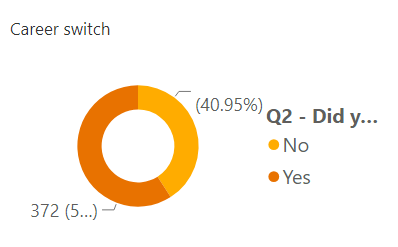
3.1 Career Switching
One of the strongest trends is the number of career switchers:
- 59.05% of participants entered data after working in another field.
- Only 40.95% started with data directly.
This underscores the accessibility and appeal of data careers, drawing professionals from business, finance, IT, and even non-technical fields.
3.2 Entry into Data
When asked how difficult it was to break into the field, responses varied:
- Neither easy nor difficult: 269
- Difficult: 156
- Easy: 134
- Very difficult: 44
- Very easy: 27
- The majority experienced some challenges, but a few found it impossible. This indicates that while barriers exist, the field remains open to motivated learners.
 |
3.3 Top Job Titles
The five most common roles were:
- Data Analyst
- Student / Looking for a job
- Data Engineer
- Data Scientist
- Business Analyst
This reflects both the strong demand for entry-level analysts and the ongoing prestige of advanced roles like Data Scientist and Data Engineer.

4. Languages
4.1 Programming Preferences
Python continues to dominate the data landscape:
- Python: 420 votes
- R: 101
- SQL: 43
- Other mentions: C/C++, JavaScript, Excel, SAS, VBA, DAX.
Python’s dominance reflects its versatility — from machine learning to business analytics — and its role as the industry’s default skill.

5. Job Satisfaction
Participants rated different aspects of job satisfaction on a 0–10 scale. Results were mixed:
- Coworkers: 5.86
- Work/Life Balance: 5.74
- Learning New Things: 5.61
- Management: 5.33
- Upward Mobility: 4.76
- Salary: 4.27
This ranking shows that while data professionals enjoy collaboration and continuous learning, frustrations exist around salary growth and career progression.

6. What’s Driving Job Changes?
When asked what factors matter most in searching for new opportunities, respondents highlighted:
- Better salary – 297 responses
- Remote work – 127 responses
- Good work-life balance – 117 responses
- Good company culture – 54 responses
Salary remains the top motivator, but flexibility and balance are increasingly shaping job decisions — reflecting broader workforce trends.
 |
7. Salary Insights
7.1 By Country
- Highest paying: United States
- Followed by Canada and Portugal.
- This reflects the maturity of the U.S. market, but also the increasing competitiveness of global data salaries.

7.2 By Gender
- Male professionals earn significantly more.
- The gender pay gap is around 12%, highlighting persistent inequities.

7.3 By Industry
Top-paying industries:
- Technology
- Retail
- Finance
- Education
- Real Estate
Technology’s lead is unsurprising, but the presence of retail and education suggests data is becoming critical even in traditionally non-digital sectors.

7.4 By Job Title
The top earners were:
- Data Scientists
- Data Engineers
These roles command the highest pay due to their technical depth and business impact.

8. Key Insights for the Future
- The gender gap remains critical. While the field is growing, women remain underrepresented and underpaid.
- Career switching is normal. Companies should embrace diverse backgrounds when hiring data professionals.
- Python is here to stay. For beginners and advanced users alike, it is the language of choice.
- Salaries are top of mind. Employers looking to attract talent must compete on pay, but flexibility and balance are rising factors.
- Education matters, but not excessively. A bachelor’s degree is enough for most roles — opening opportunities to a wide audience.
9. Conclusion
The survey highlights a data profession that is vibrant, accessible, but still facing challenges around diversity, mobility, and fair compensation. For professionals, the message is clear: continuous learning and adaptability are key. For employers, success depends on pay equity, career development opportunities, and flexibility.
As data continues to shape the global economy, the professionals behind it remain at the center of innovation — and this report captures their evolving story.