
Training instructor: Carlton Seymour
In this training, we will cover the fundamentals of Power BI, focusing on topics such as:
- Data Modeling
- DAX (Data Analysis Expressions)
- Report Formatting
To make this training practical, we’ll use fictional data from the Ministry of Tourism in Qatar. The dataset includes the following columns:
- Date
- Visa Type
- Visa Purpose
- Country
- Region
- Visitor Numbers
Table of Contents
Step 1: Data Modeling
1.1 Importing Data
- Go to Get Data and click on the source file which in our case is the Excel file.
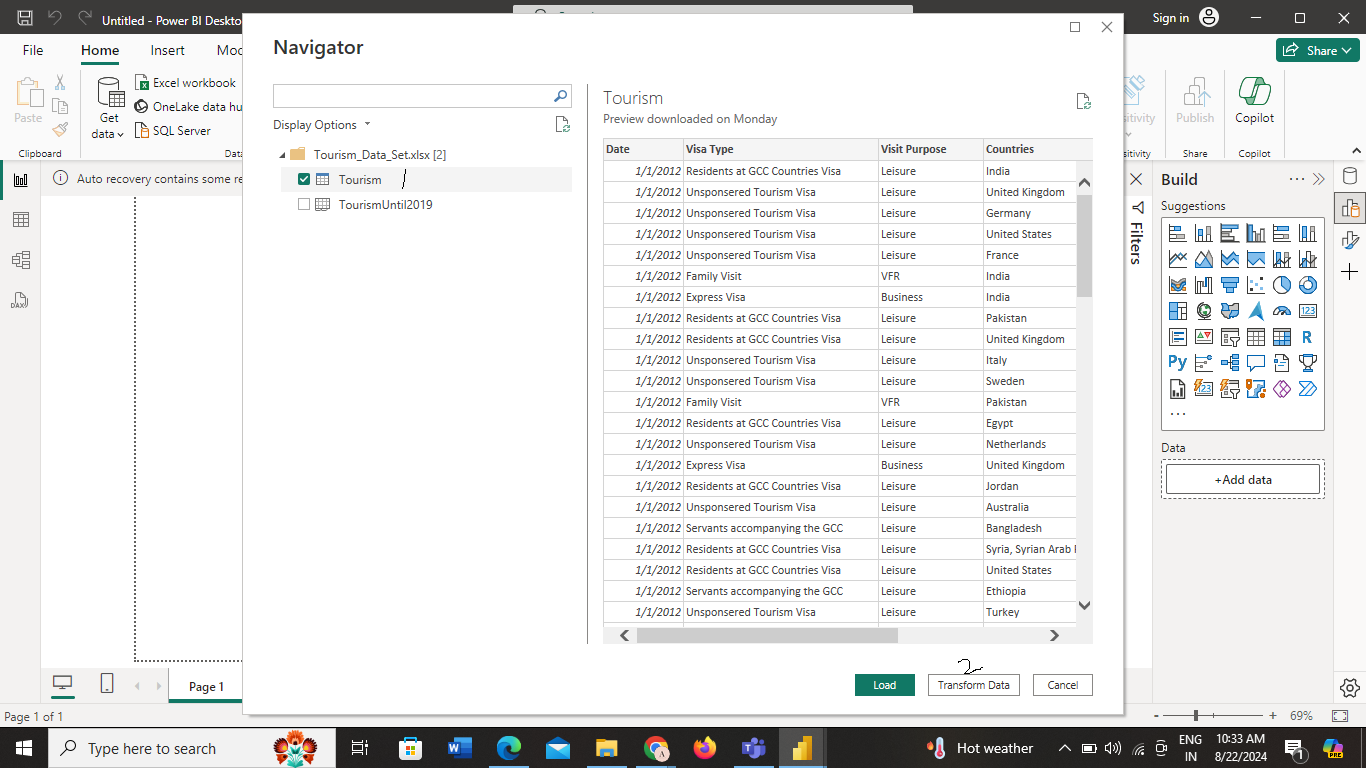
- Select the tourism data file and click Transform Data.
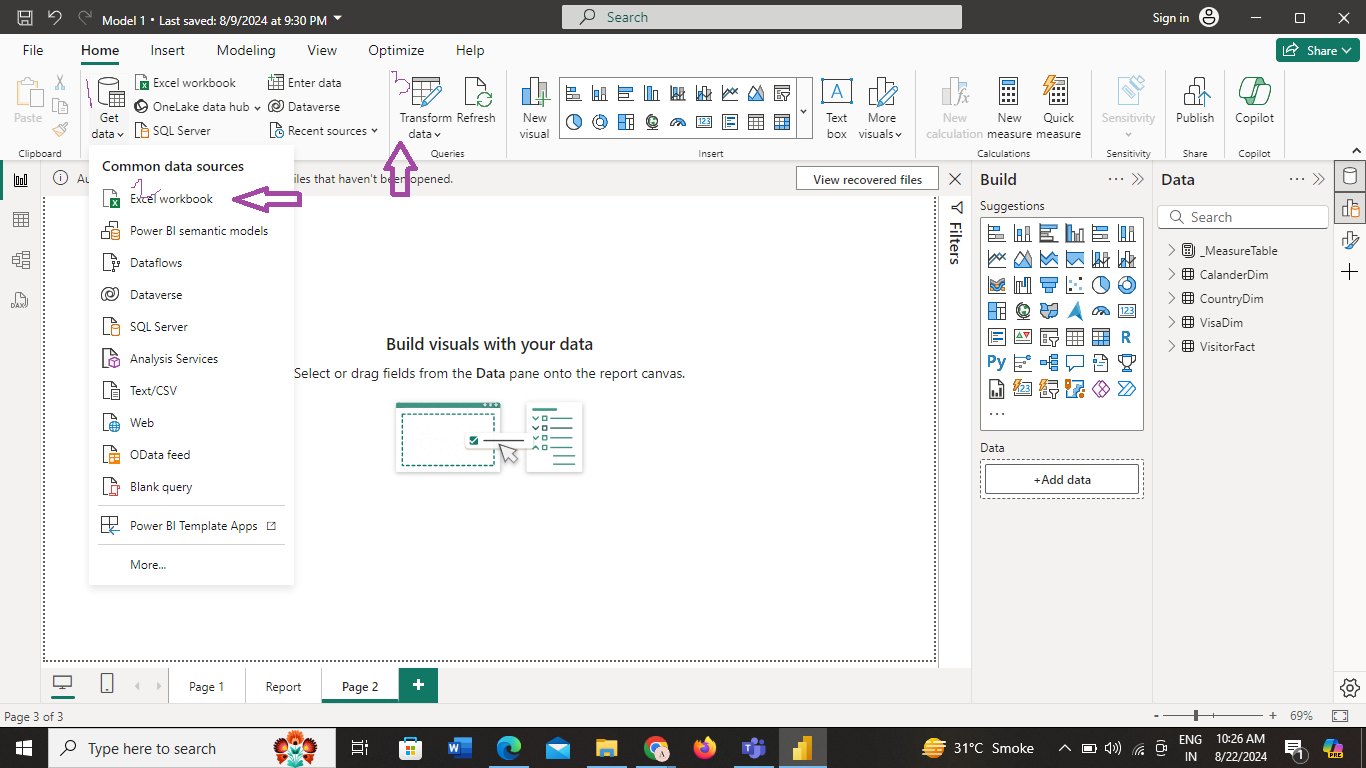
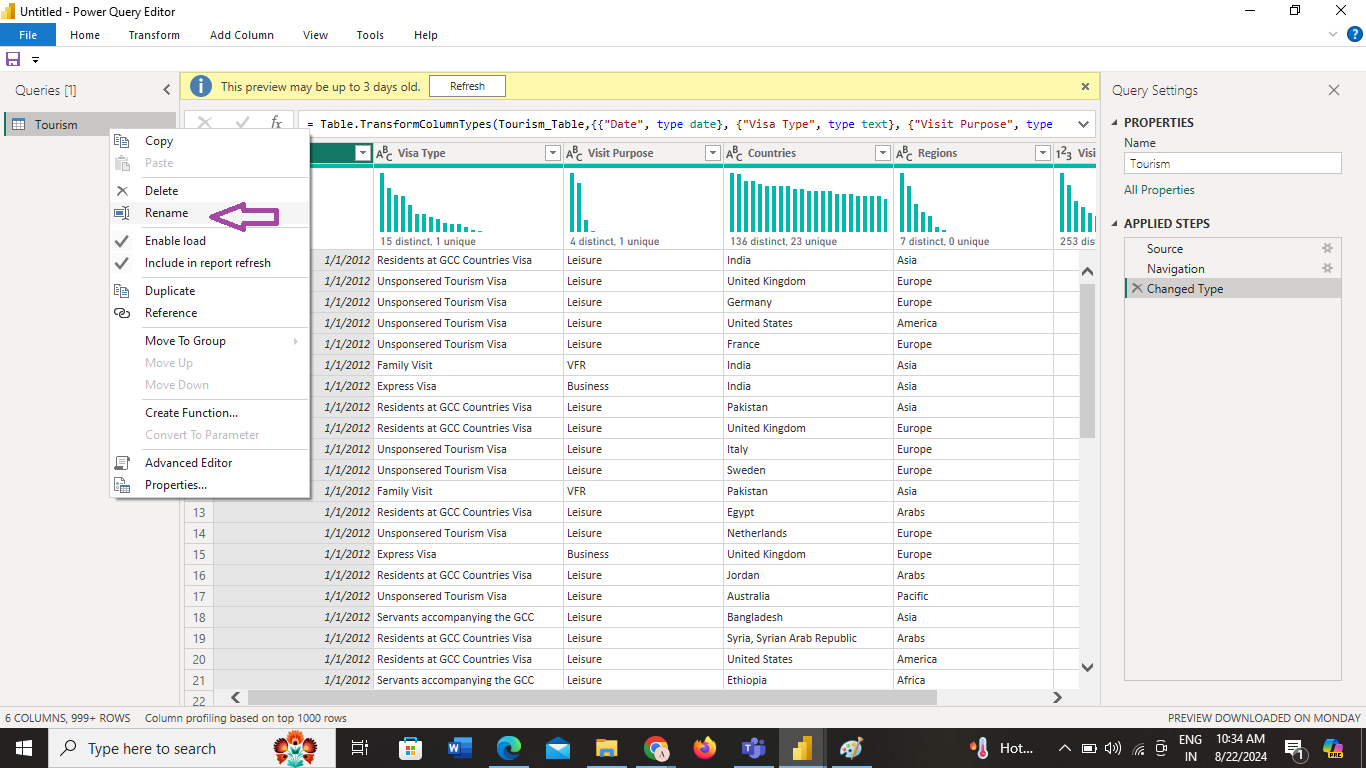
- Rename the file as Raw Data:
- Right-click on the file name.
- Click Rename and type “TourismRaw”.
1.1a Creating staging table
- Right-click on the Raw Data and select Reference.
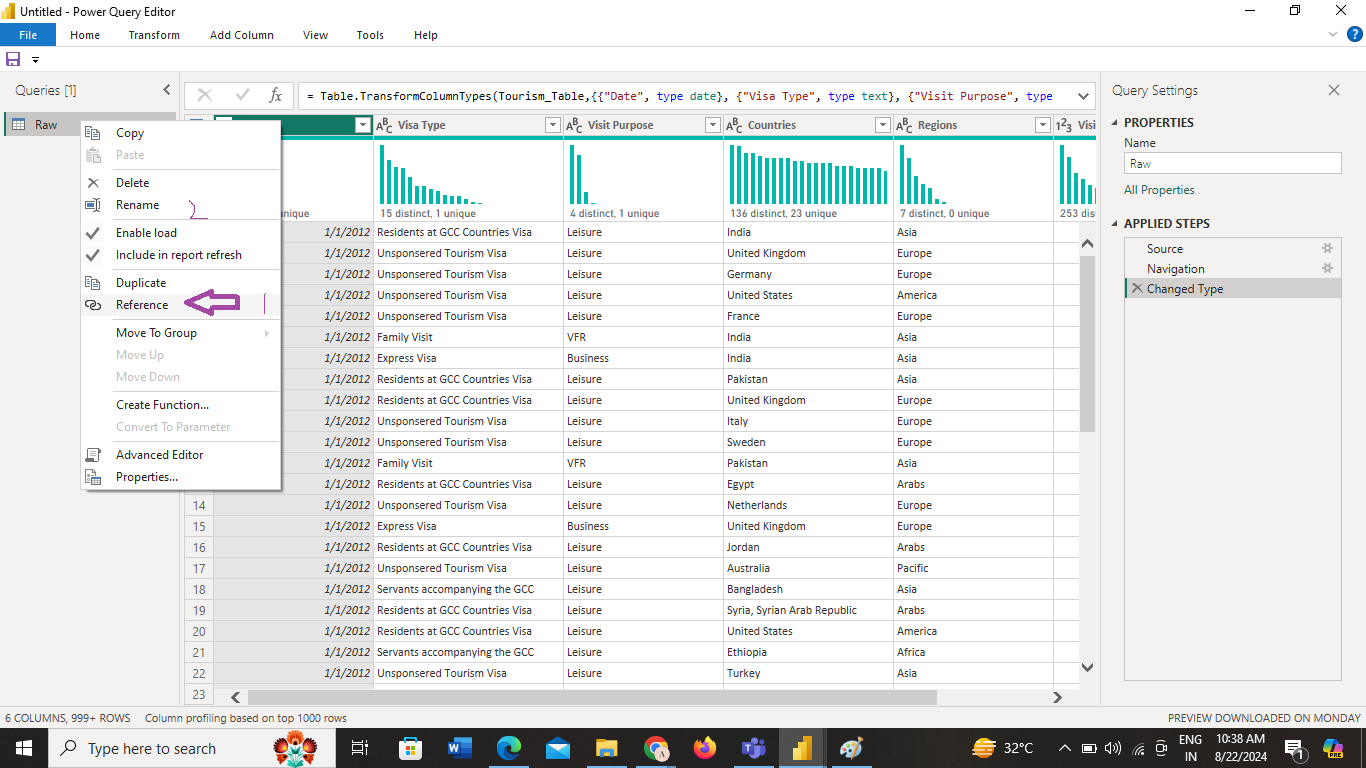
- Rename it as TourismStaging.
- We‘ll use this table to create further Dimension and Fact tables.
1.2 Creating Dimension Tables
- Visa Dimension (VisaDim) Table:
- Right-click on the StagingTourism Table and select Reference.
- Rename it as VisaDim.
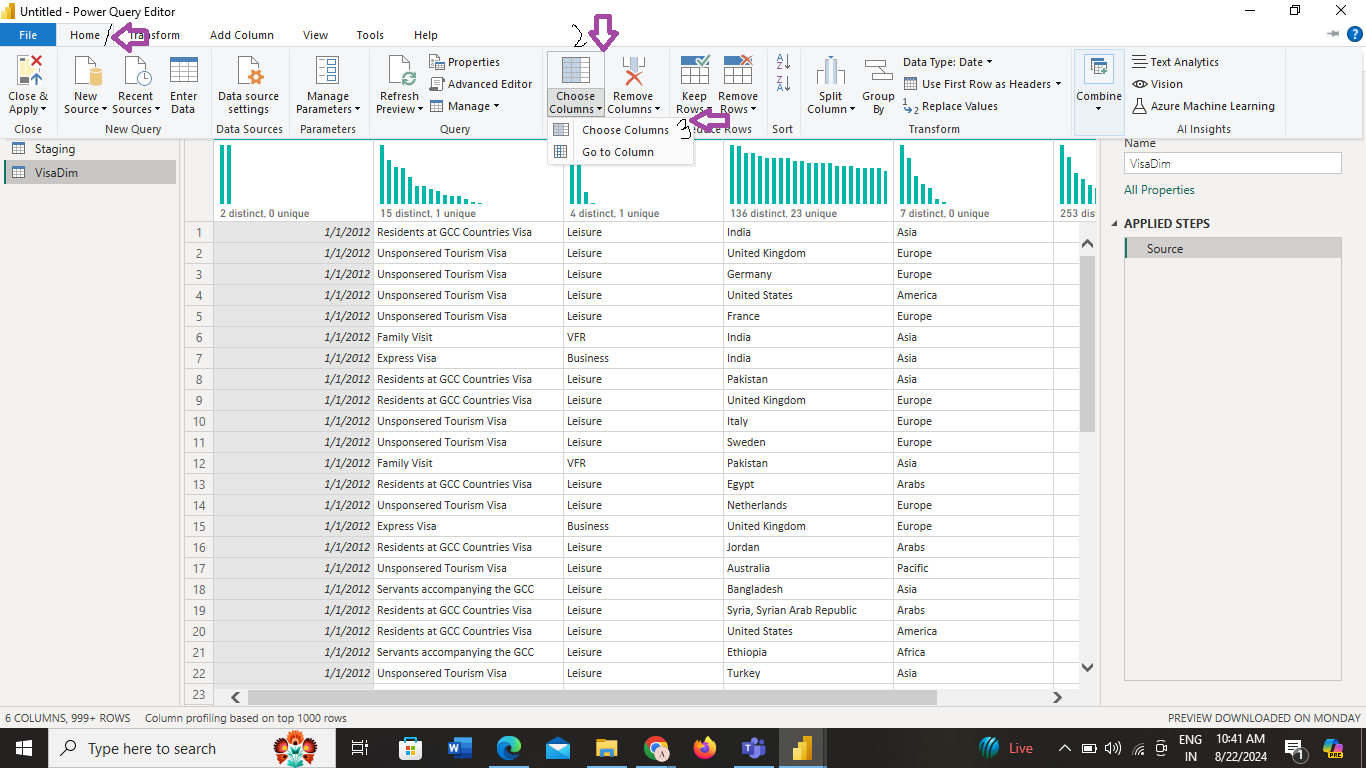
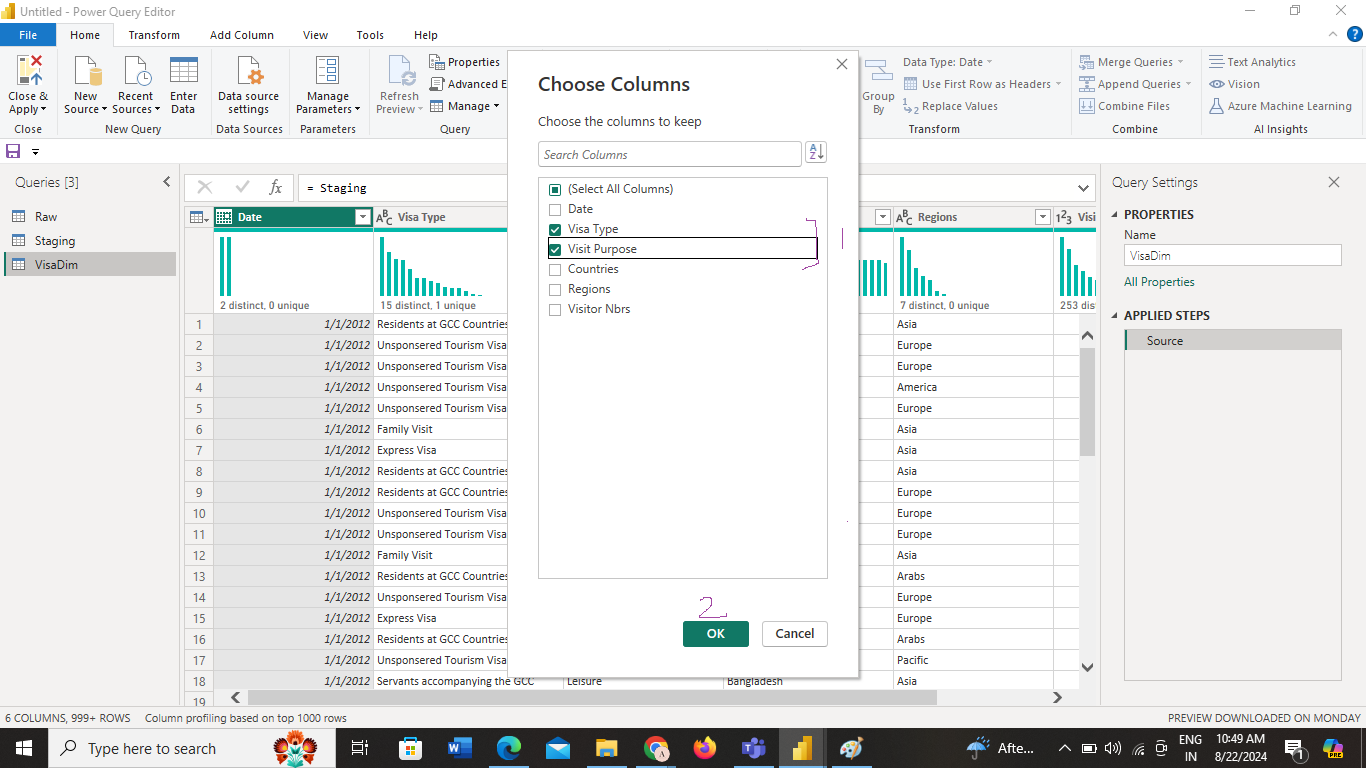
- Go to Home > Choose Columns and select Visa Type and Visa Purpose.
- Select Visa Type column>right click>remove duplicates. This will create unique rows in the VisaDim Table
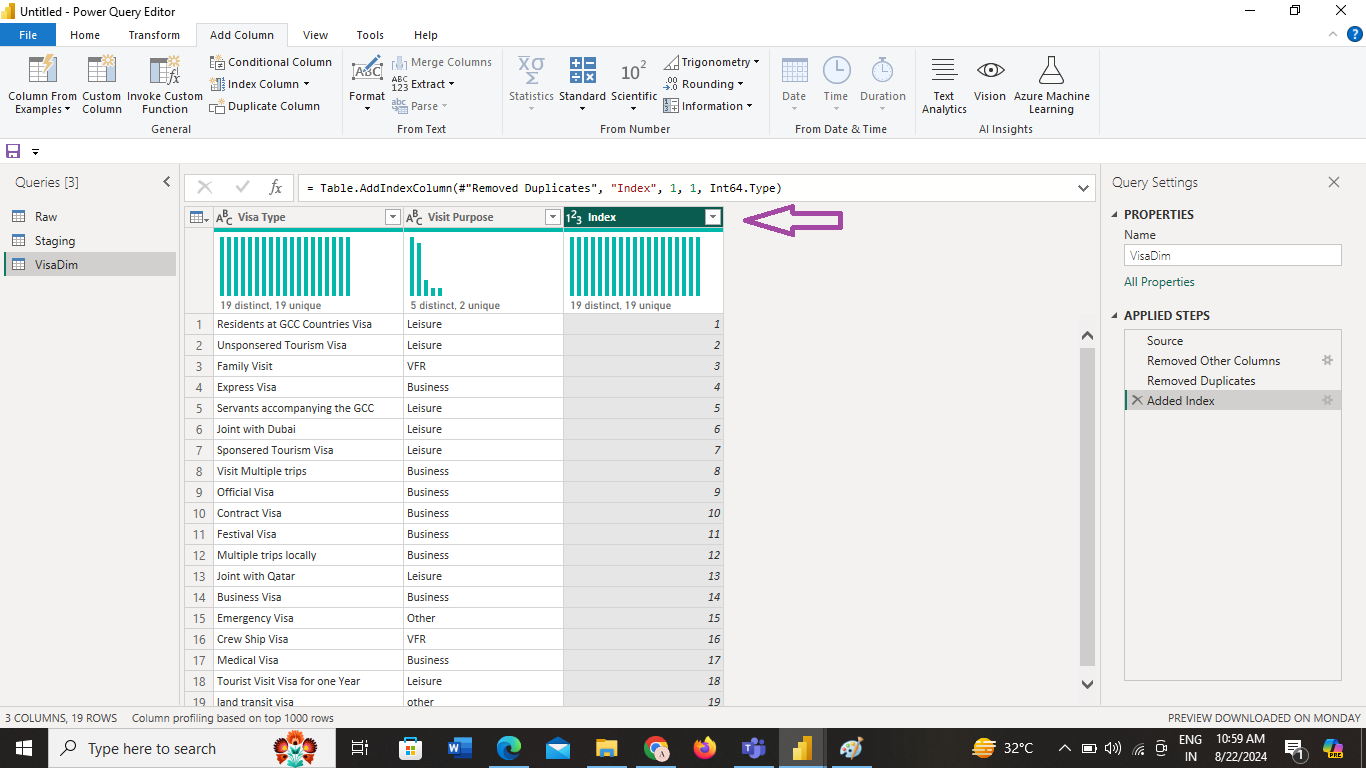
- Click Add Column > Index Column > From 1.
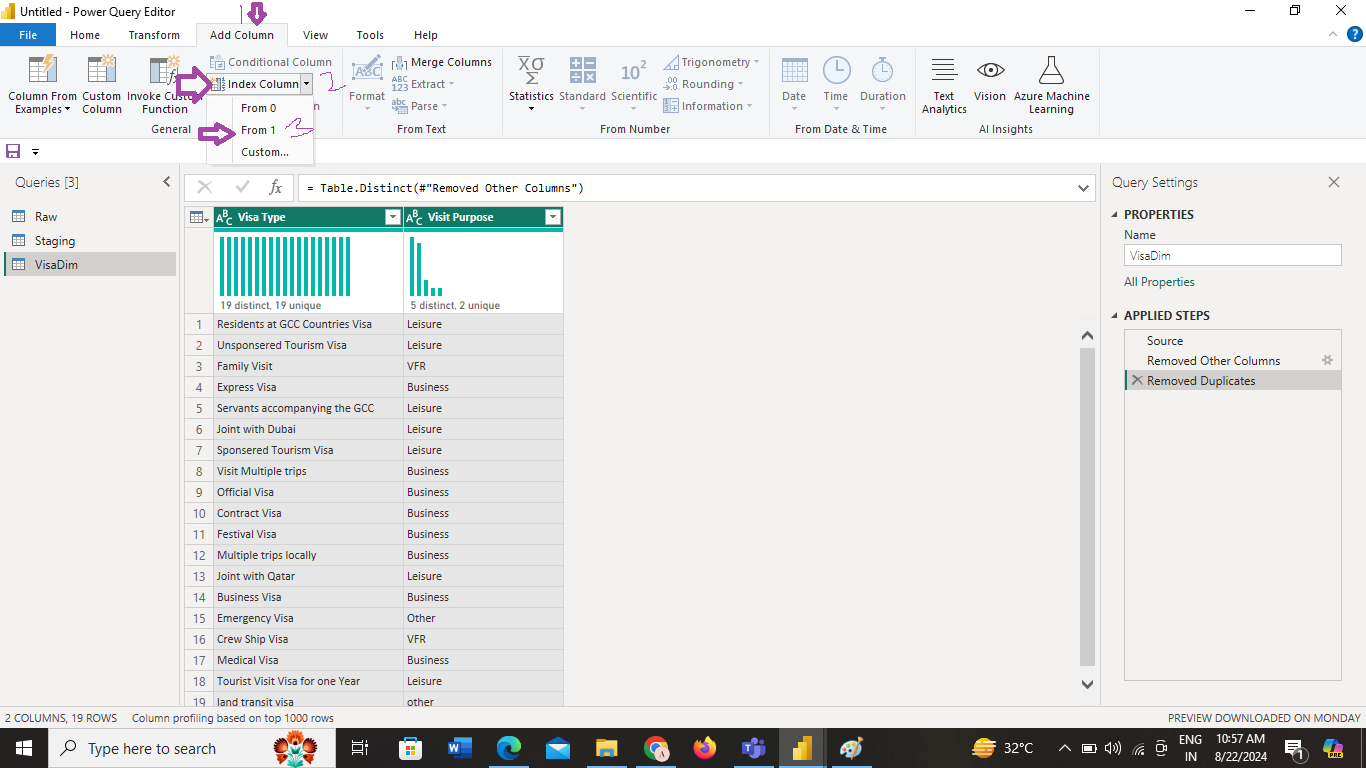
- A new column Index is created.
- Rename the new column as VisaPK which stands for Primary Key and drag it to the left most side of the table.
Country Dimension (CountryDim) Table:- Repeat the steps above with Country and Region columns.
- Rename the new index column as CountryPk.
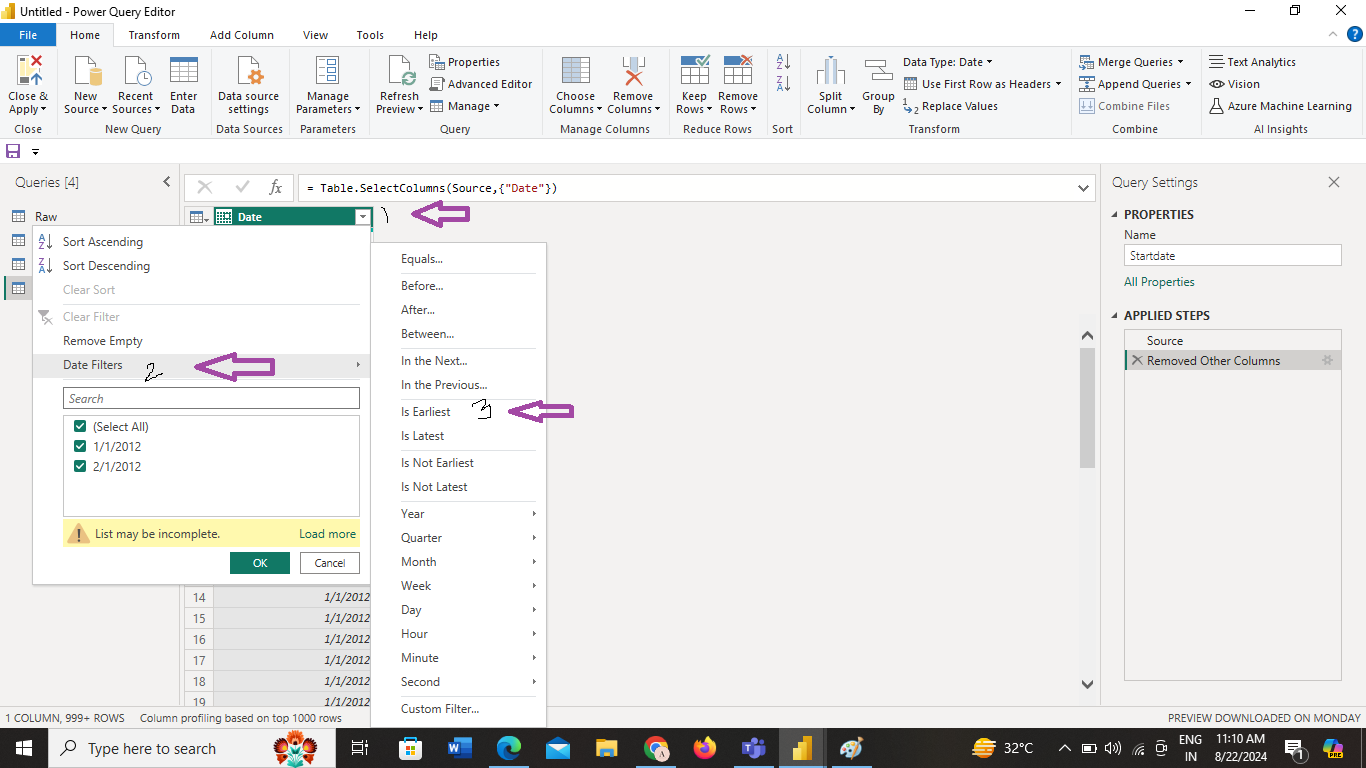
To create a Dynamic Calendar table you will need to create the StartDate and EndDate Table
Filter for the Earliest Date:
- Click on the triangle icon in the Date column header.
- Go to Date Filters and select Is Earliest.
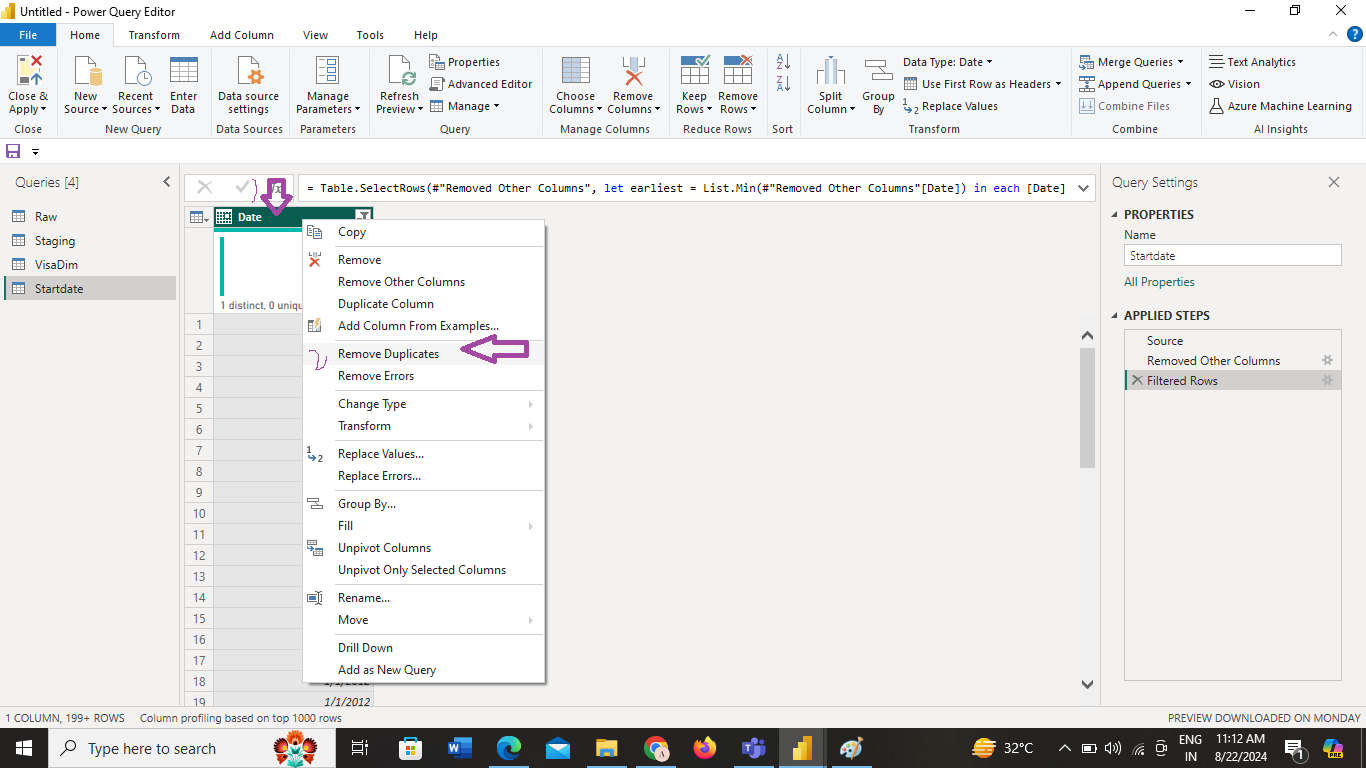
- Remove Duplicates:
- Click on the green line in the Date column.
- From the menu, choose Remove Duplicates.
- Drill Down:
- Click on the gray line at the bottom of the Date column.
- From the menu, select Drill Down.
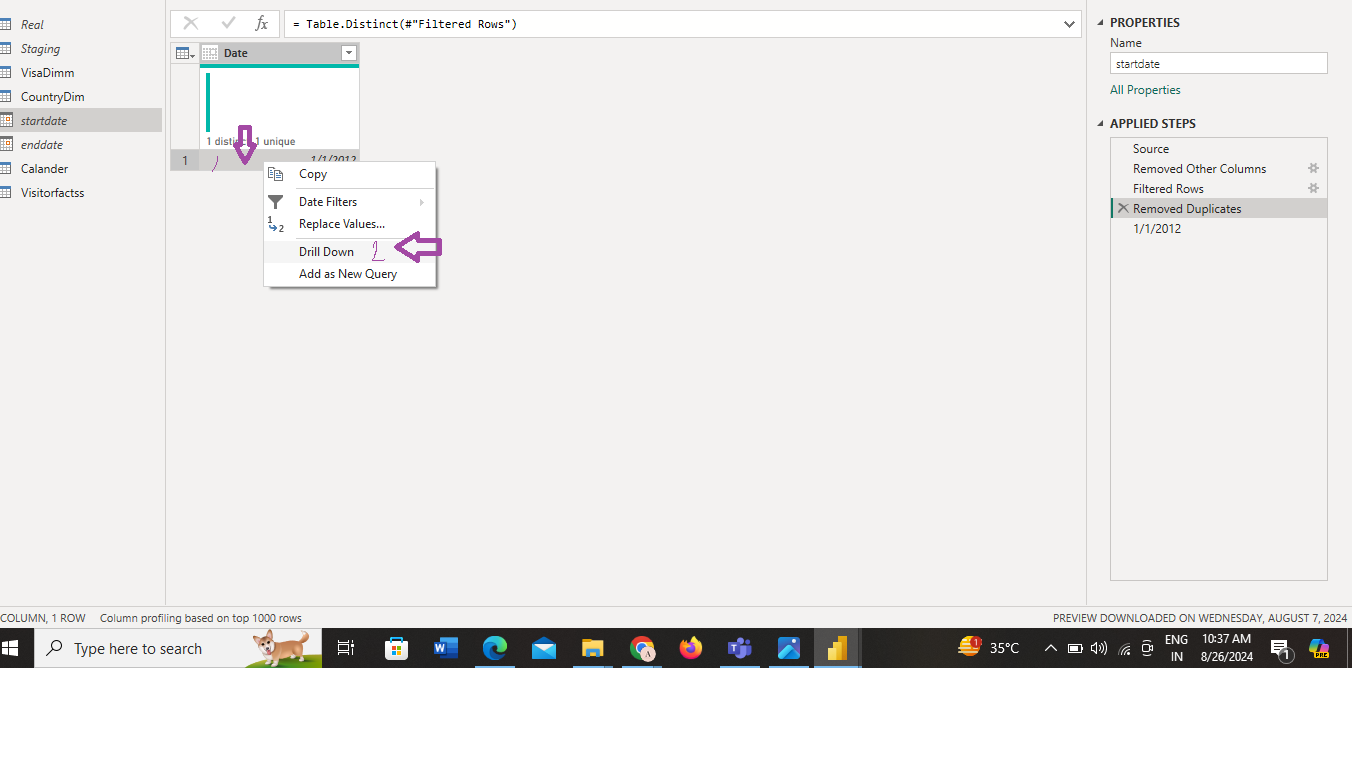
- Create the EndDate Table:
- Repeat this process for the EndDate table.
- This time, select Is Latest instead of Is Earliest in the Date Filters step.
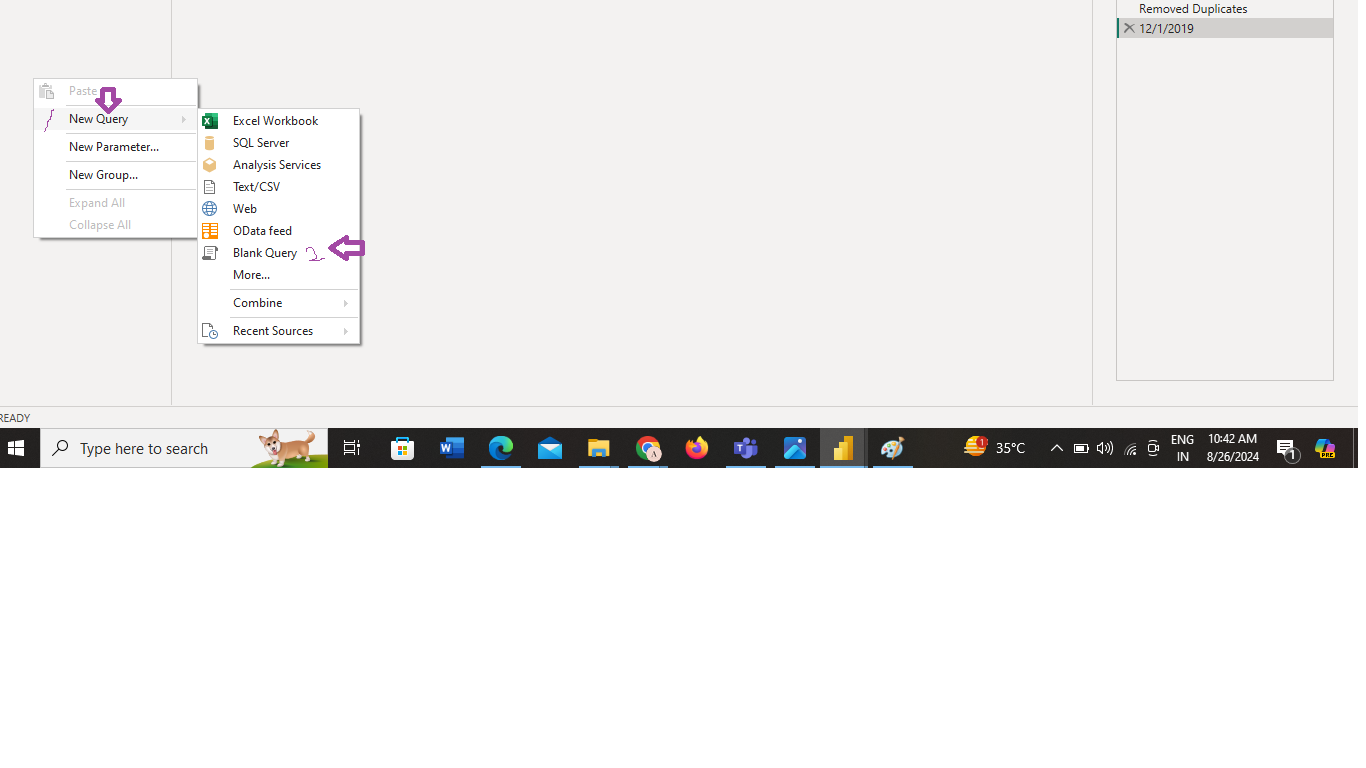
1.3 Creating Calander Table
Create a Blank Query:
- On the left side of the page, click on the blank space.
- A menu will appear; select New Query and then Blank Query.
Generate a List:
Enter the following formula to generate a list:
= List.Dates(StartDate, Duration.Days(EndDate – StartDate), #duration(1, 0, 0, 0))
- Click on the list and select Convert to Table.
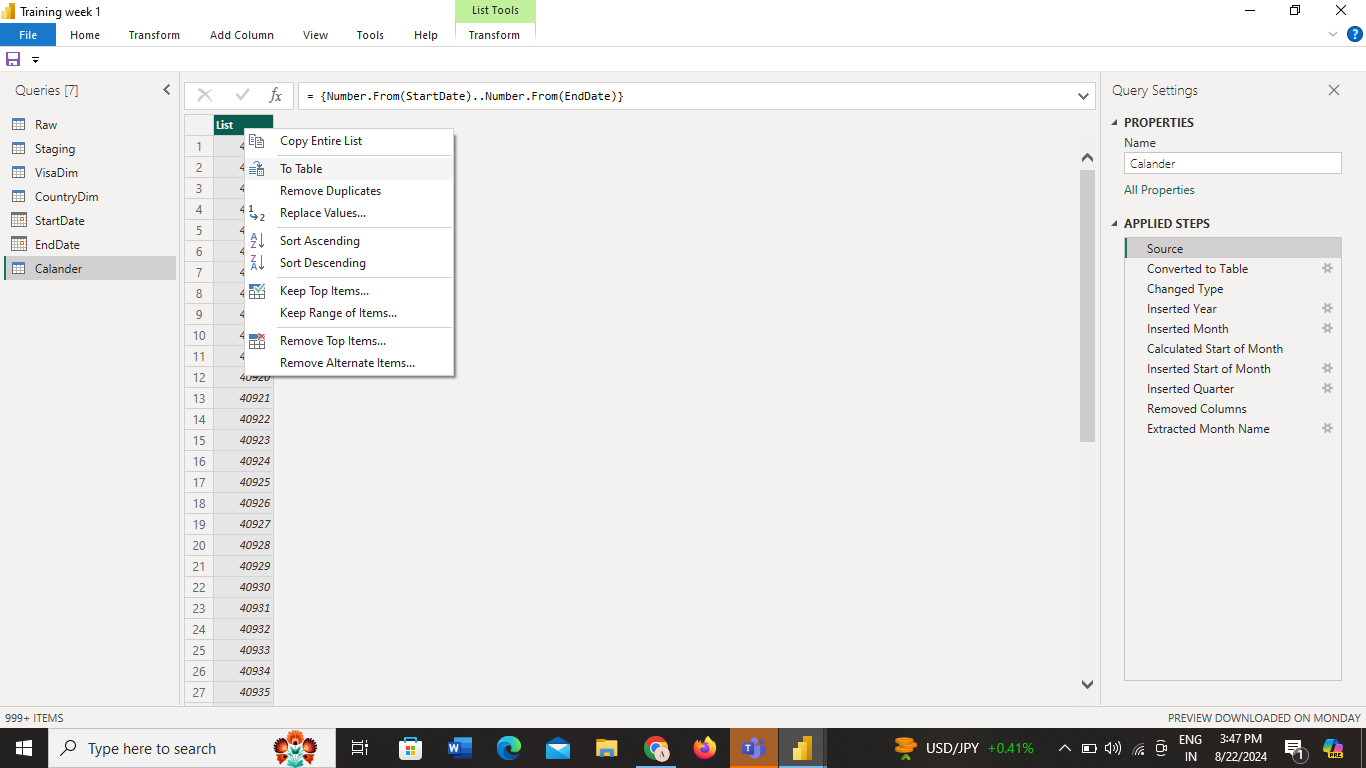
- The list will be converted into a table with a default column named Column 1.
Rename and Transform Columns:
- Rename Column 1 to Date.
- Select the Date column and click on Transform.
- Move the cursor to the Date icon, click it, and select Year.
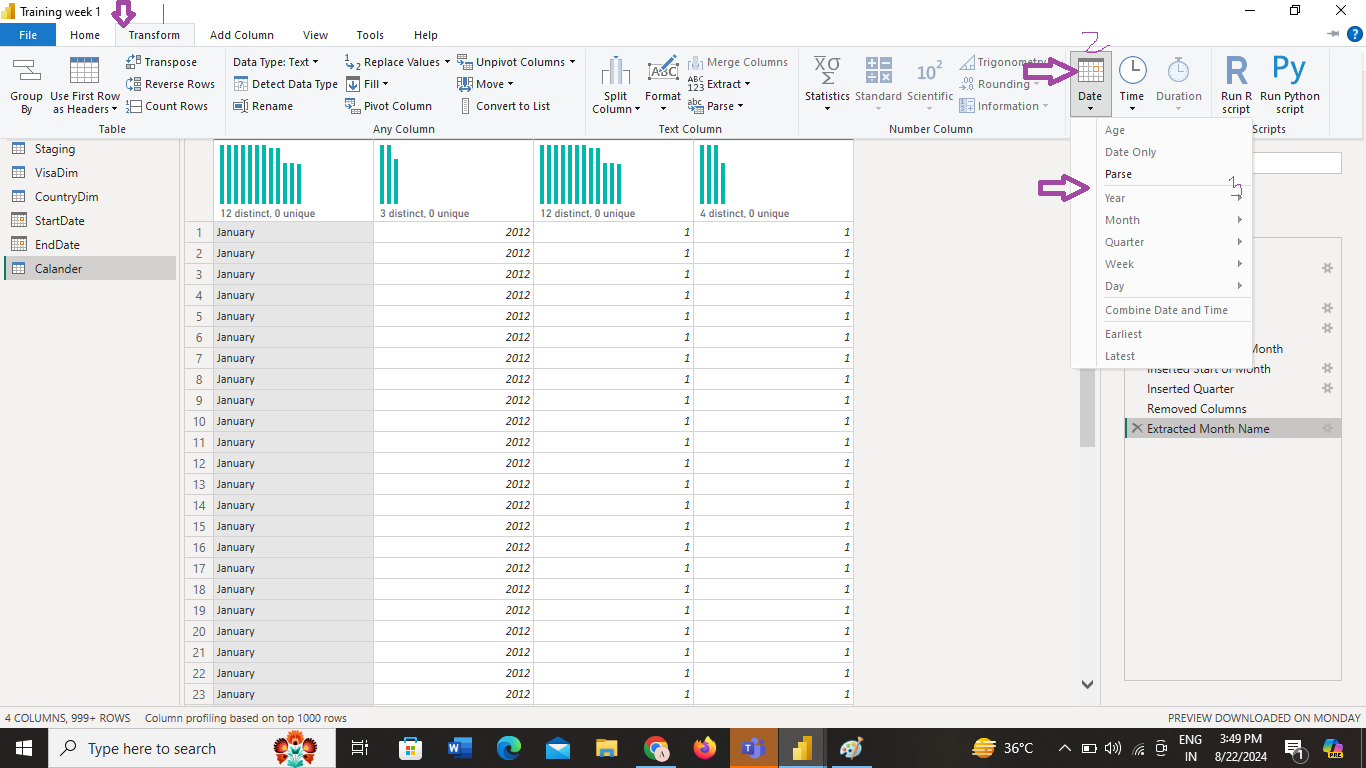
Extract Month and Month Name:
- Repeat the process for Month and Month Name.
Create Short Month Name:
- To get the initials of the month name:
- Follow the same steps as creating the month name.
- Then click Transform and select Extract.
- Choose First Characters from the menu, enter “3” in the dialogue box, and press Enter.
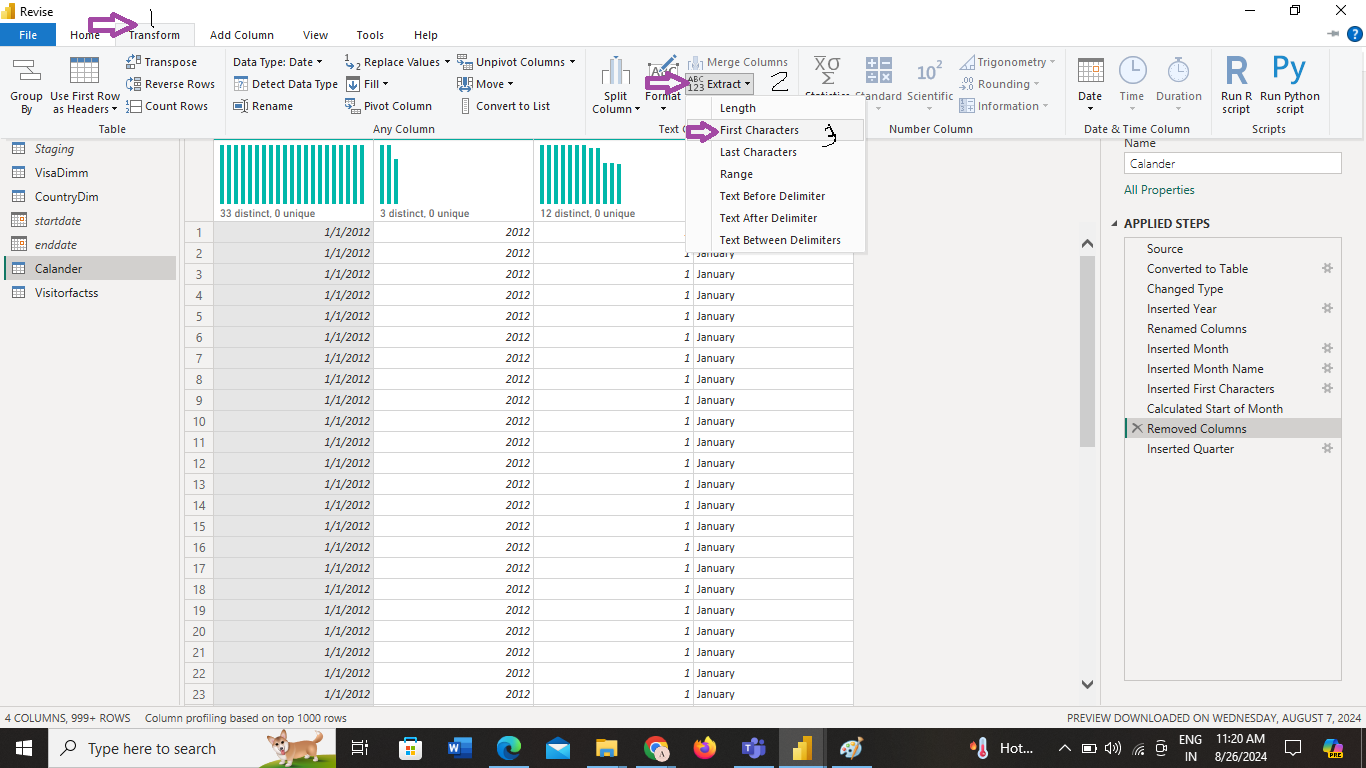
- Rename this column as Short Month.
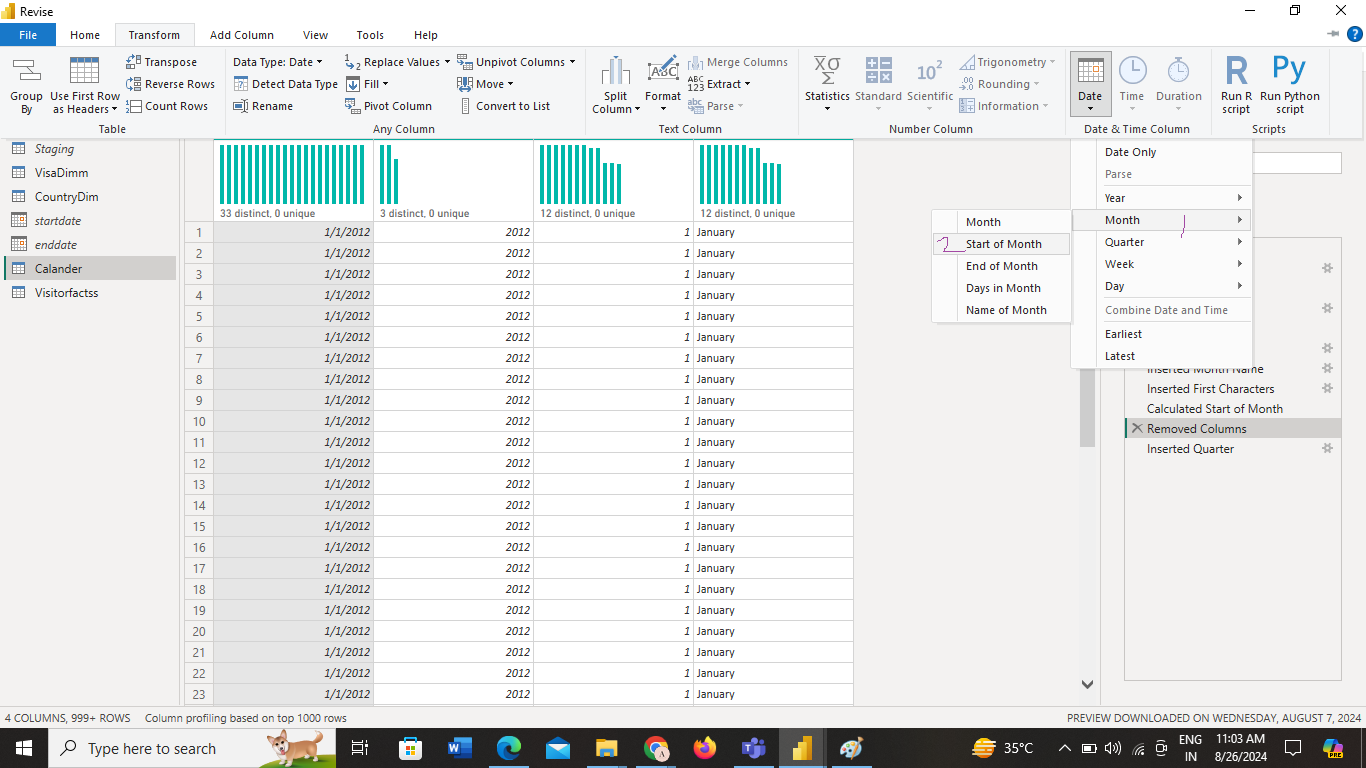
Add Additional Date Columns:
- Place the cursor on the Date column.
- Click on Add Column, then on the Date icon, and select Month.
- Repeat the process to add Start of Month and End of Month columns.
Add Quarter of Year Column:
- Follow the same process to add a Quarter of Year column
1.4 Creating the VisitorFact Table
- Create the VisitorFact Table:
- Click on the Staging table.
- From the menu, select Reference to create a new table.
- Rename this new table as VisitorFact.
- Select Columns:
- Go to the Transform tab and click on Choose Columns.
- Select the following columns: Visa Type, Country, Visa Number, and Date.
- Merge with CountryDim:
- In the Home tab, hover over the Combine icon.
- Click on Merge Queries.
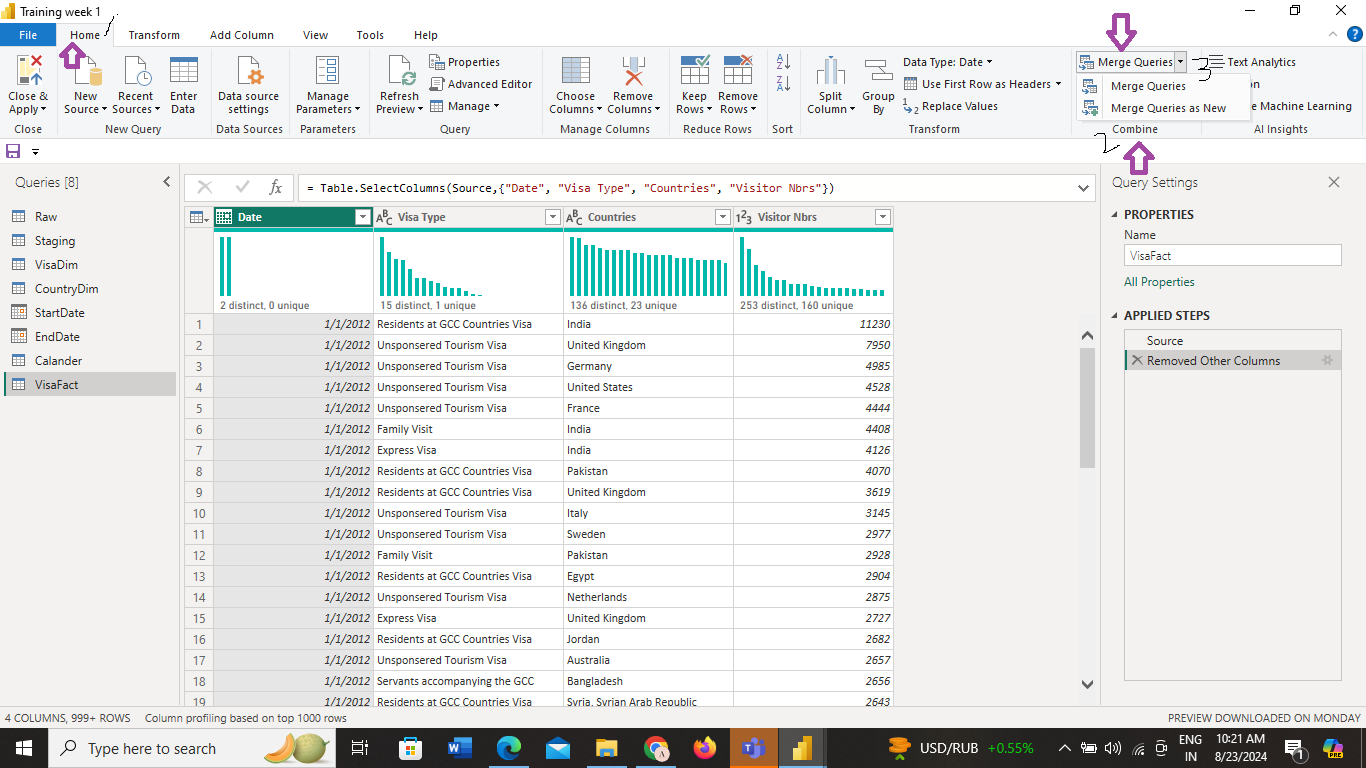
- In the dialogue box that appears, select the CountryDim table.
- Identify the common column between the two tables, which is Country.
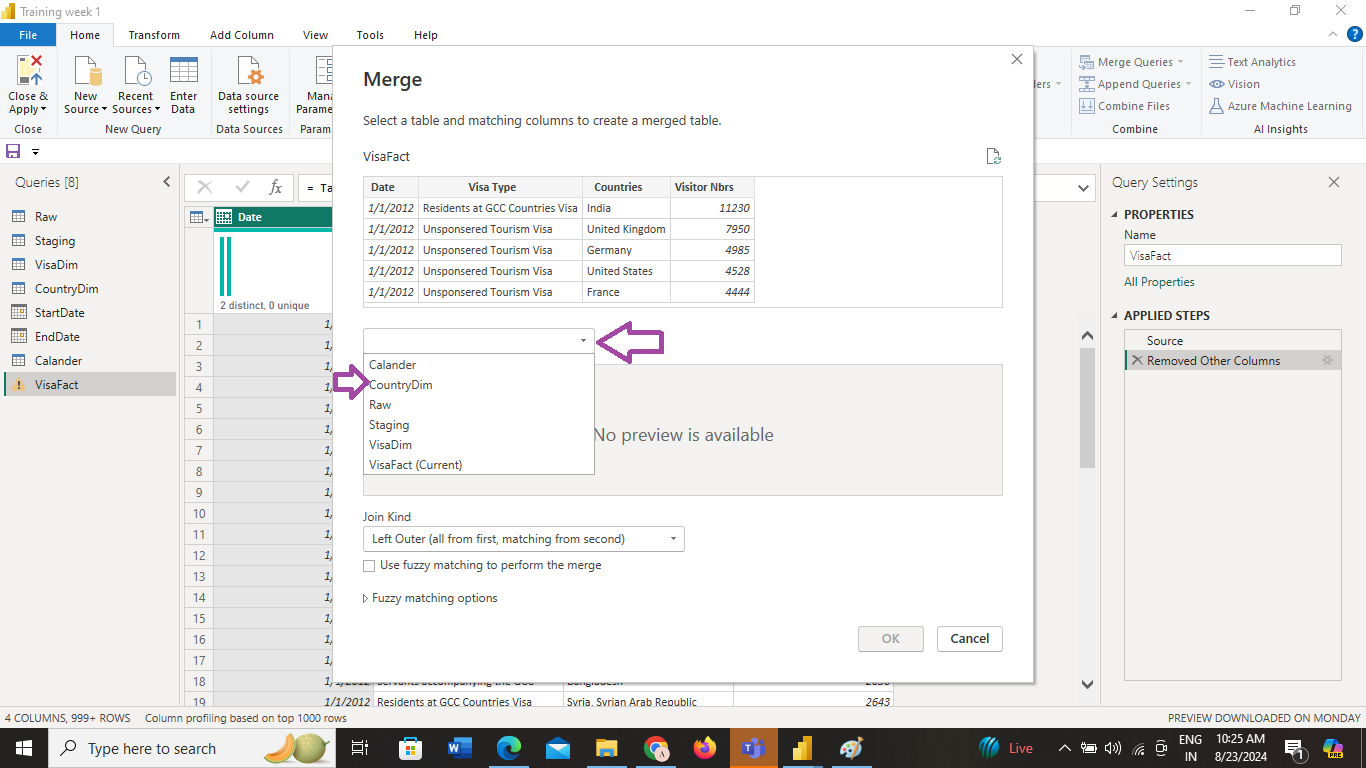
- Select the Country column from both tables, then click OK.

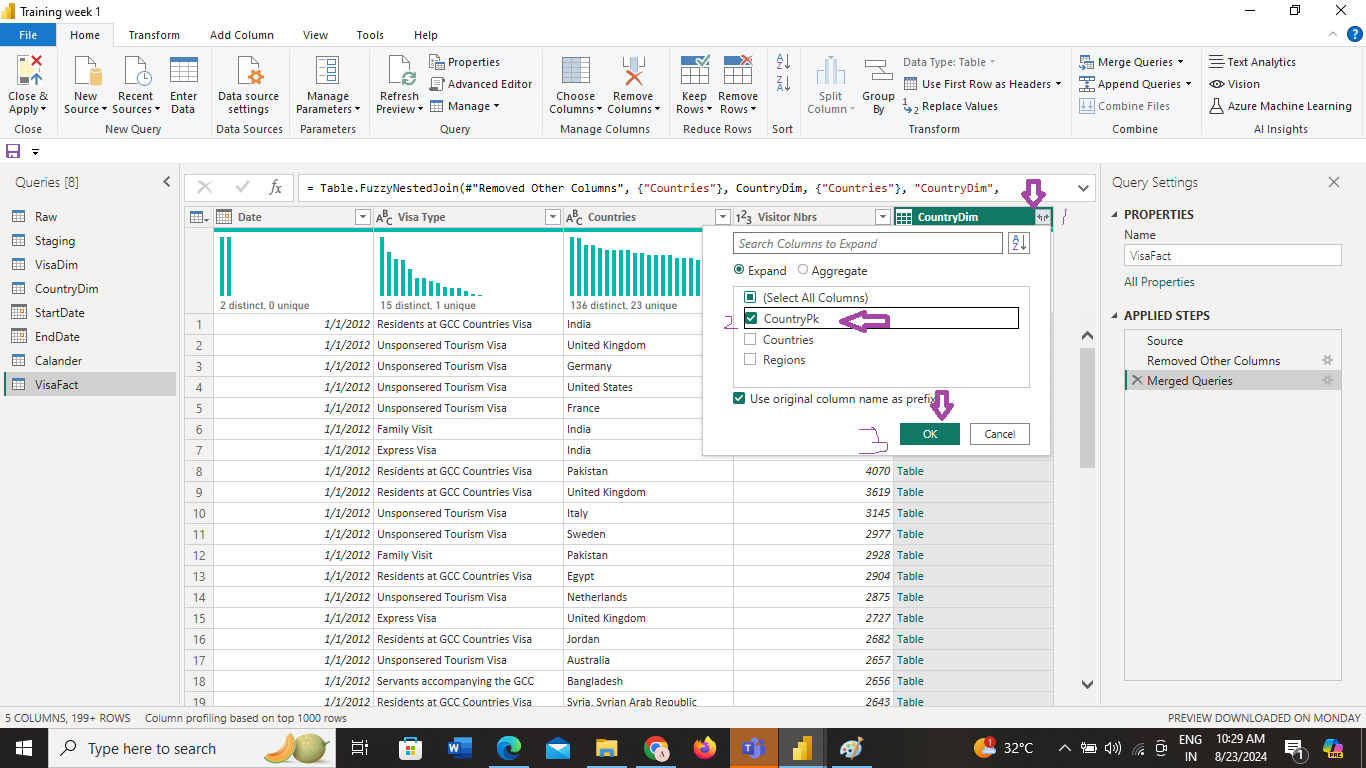
- Expand and Select CountryPk:
- A new column will be added to the VisitorFact table.
- Click on the two-arrow icon next to this new column.
- Uncheck all columns except for CountryPk.
- Repeat the Process:
- Repeat the merge process for the Calendar table and the VisaDim table.
- Enable Only the Necessary Tables:
- On the left side of the page, select each table (VisaDim, CountryDim, Calendar, and VisitorFact).
- check tables you need to include in the final model.
- Save Your Data Model:
- Click on File at the top left of the page.
- Select Save and then close.

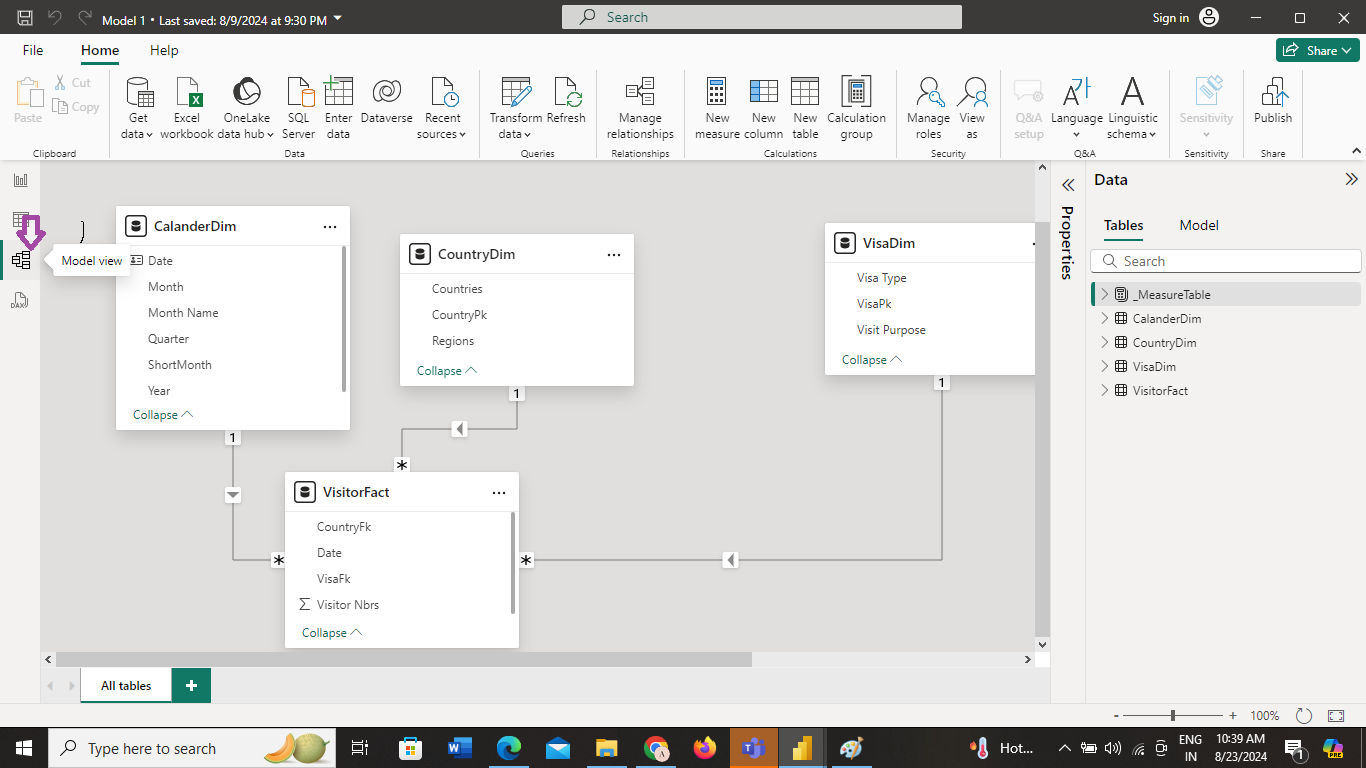
Now go to Model and you will see a star schema.
Congratulations!
You have successfully created your data model.
Step 2: DAX in Power BI
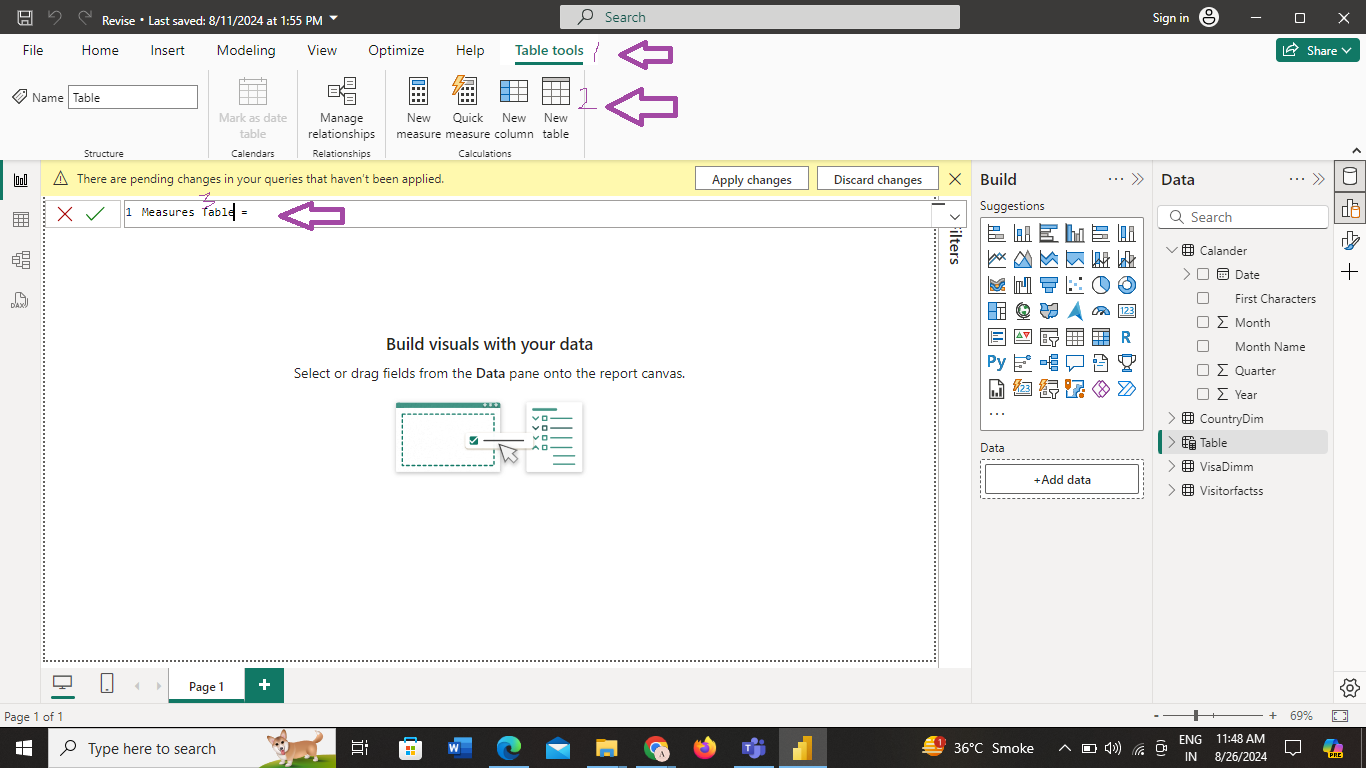
2.1 Creating a Measure Table
- Go to Table Tools > New Table and name it MeasureTable.
- This table will hold all your DAX measures.
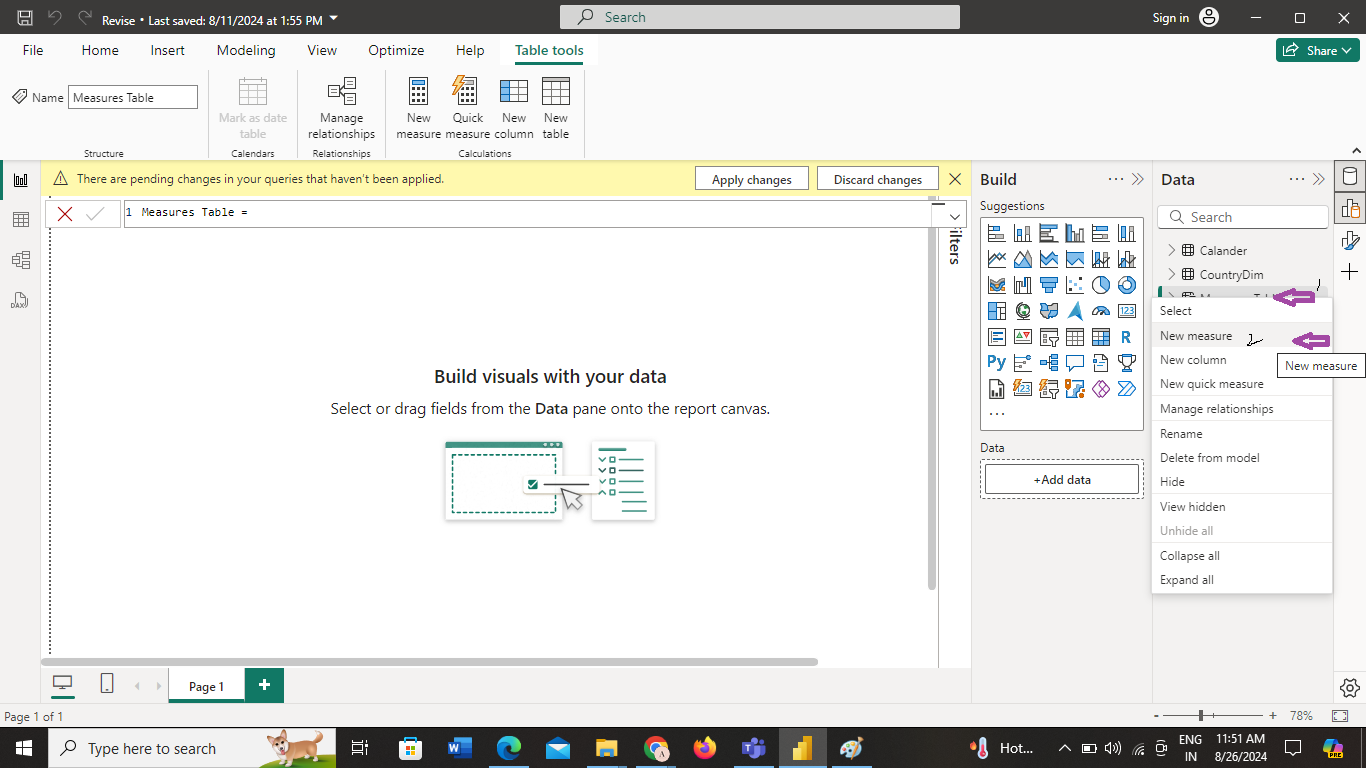
2.2 Writing DAX Measures
- Right-click on MeasureTable and select New Measure.
Enter your DAX formulas, such as:
All Visitors = CALCULATE([Total Visitors], ALL(VisitorFact))
Some of the DAX measures you’ll create:
% Total Visitors:
% Total Visitors = DIVIDE([Total Visitors], [All Visitors])
VFR Visitors:
VFR Visitors = CALCULATE([Total Visitors], VisaDim[Visit Purpose] = “VFR”)
Leisure Visitors:
Leisure Visitors = CALCULATE([Total Visitors], VisaDim[Visit Purpose] = “Leisure”)
Rank Country by Visitors:
Rank Country by Visitors = RANKX(ALL(CountryDim[Countries]), [Total Visitors], , DESC)
TopN Visitors by Country:
TopN Visitors by Country = IF([Rank Country by Visitors] <= 5, [Total Visitors])
Step 3: Report Creation
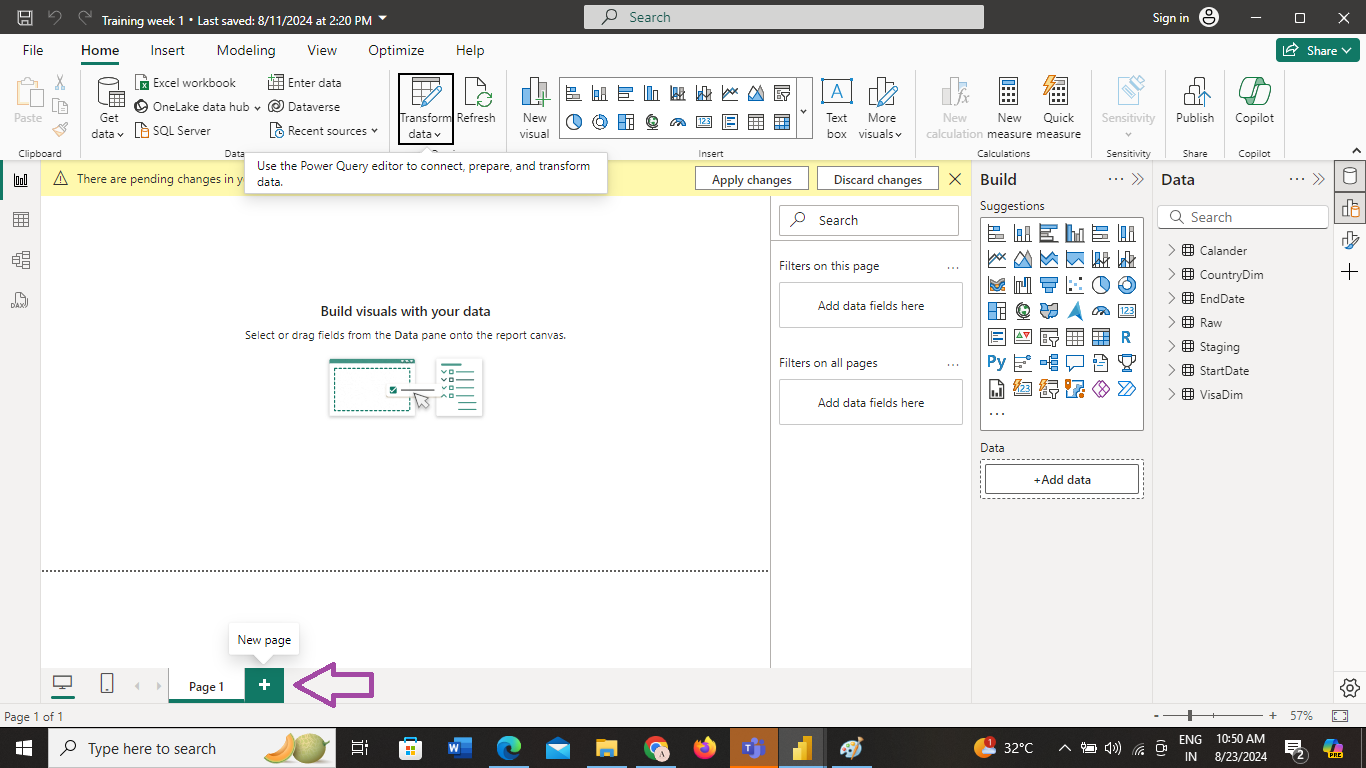
- Add a New Page:
- Click on the + icon at the bottom of the page to add a new page to the model.
- Rename this new page as Report.
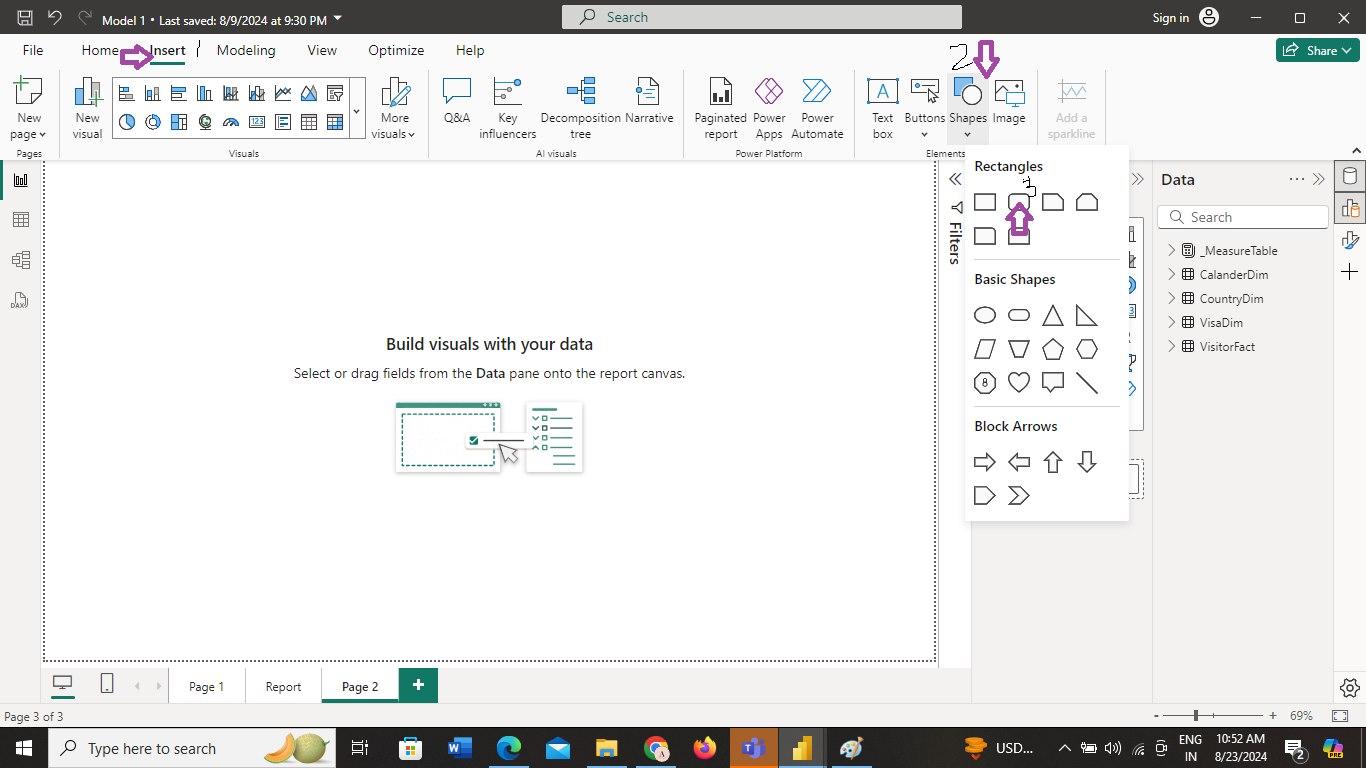
- Insert and Format Shapes:
- Go to the Insert tab at the top of the page.
- Under Shapes, select the second rectangle.
- Right-click on the rectangle and select Format.
- Set the dimensions and change the fill color to blue.
- Use Ctrl + C and Ctrl + V to create four more rectangle blocks with the same dimensions.
- Add a Card Visualization:
- From the insert pane, select the Card visual.
- In the Fields pane, right-click on Total Visitors from the Measure table and add it to the card.
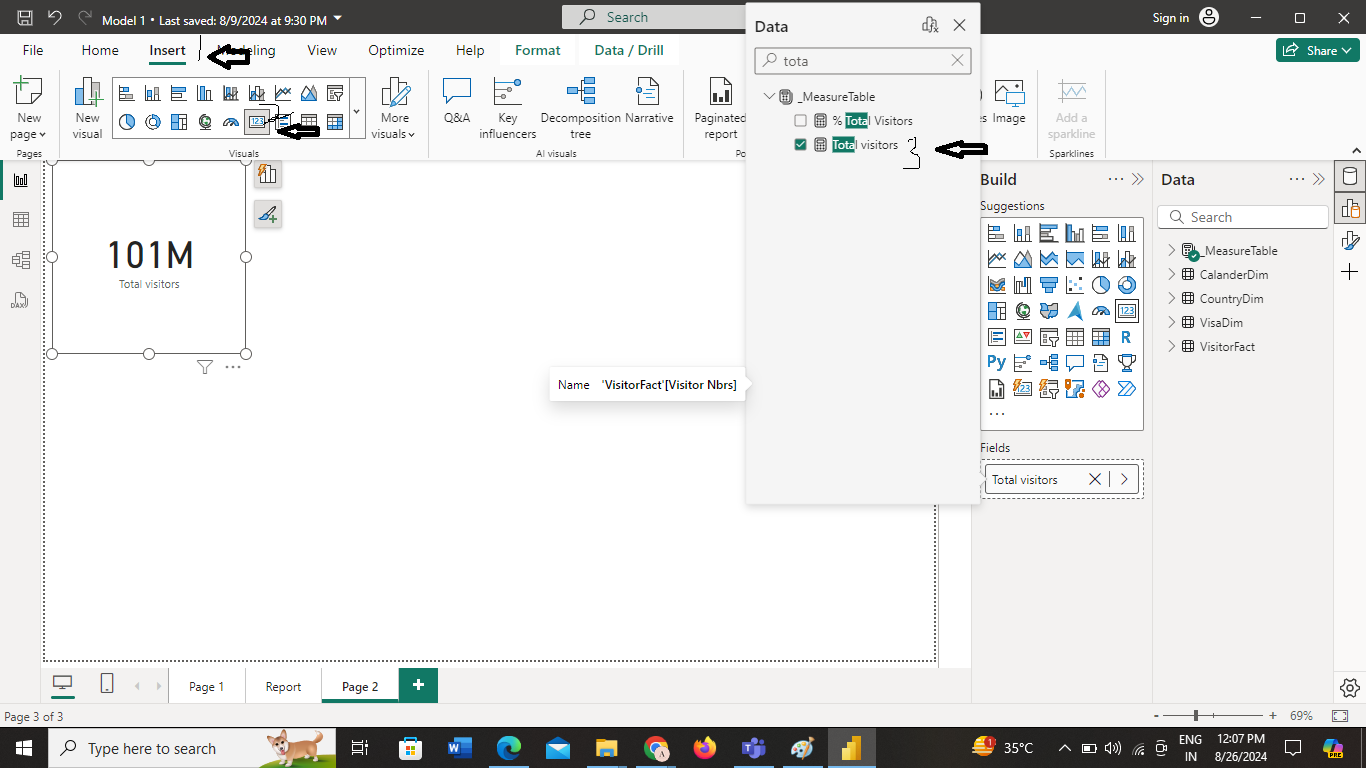
- Set the card’s dimensions to match the previously created rectangles.
- Click on Callout Value in the Format pane.
- Change the font color of the top text to orange and the bottom text to white.
- Drag and position these cards on top of the rectangle blocks.
- Create cards for total visitors,leisure visitors, business visitors,other visitors.
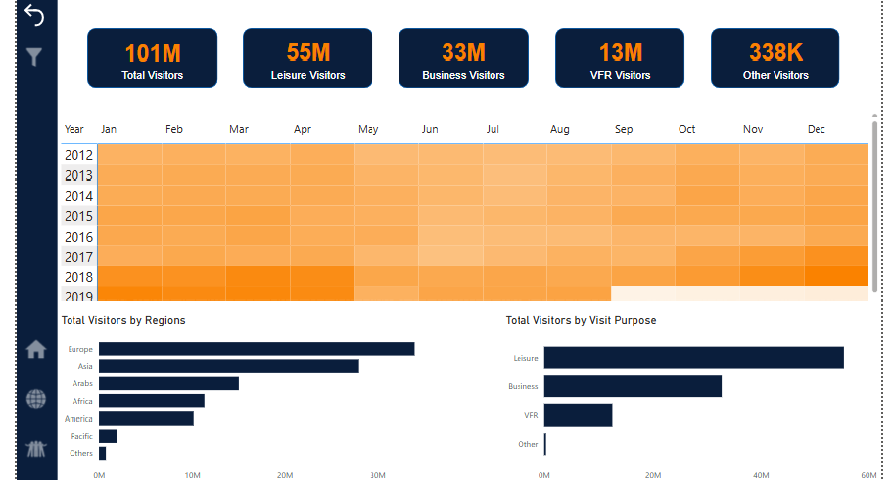
- Insert a Matrix Visualization:
- Go to Insert and select Matrix from the Visualizations pane.
- Add Years to the Rows.
- Add Short Month to the Columns.
- Add Total Visitors to the Values.
- Add Two Bar Charts:
- Go to Insert and add two Bar Chart visuals.
- First Bar Chart:
- Add Total Visitors to the X-axis.
- Add Regions to the Y-axis
- Second Bar Chart:
- Add Visit Purpose to the X-axis.
- Add Regions to the Y-axis.
- Here is our dashboard
Conclusion
This training will provide a comprehensive understanding of the fundamentals of Power BI, from data modeling and DAX to report creation, using real-world data.