
In my previous projects, I usually focused on building reports and writing insights around visuals.
This time, I intentionally set one clear learning objective for the entire project:
To deeply understand data modeling and star schema design in Power BI.
Since this dataset contains multiple related tables, it was a great opportunity to practice proper data modeling instead of just visualization.
Table of Contents
My Main Learning Objective: Data Modeling
The data was already mostly clean, so I didn’t spend much time on data cleaning. Instead, I focused on:
- Designing a star schema
- Creating correct relationships between fact and dimension tables
- Writing reusable DAX measures
- Making sure visuals respond correctly to filters and slicers
Data Model Design
I structured the dataset into a star schema, with:
- A central fact table containing sales.
- Supporting dimension tables for products, factories, regions, cities, dates, and shipping modes.
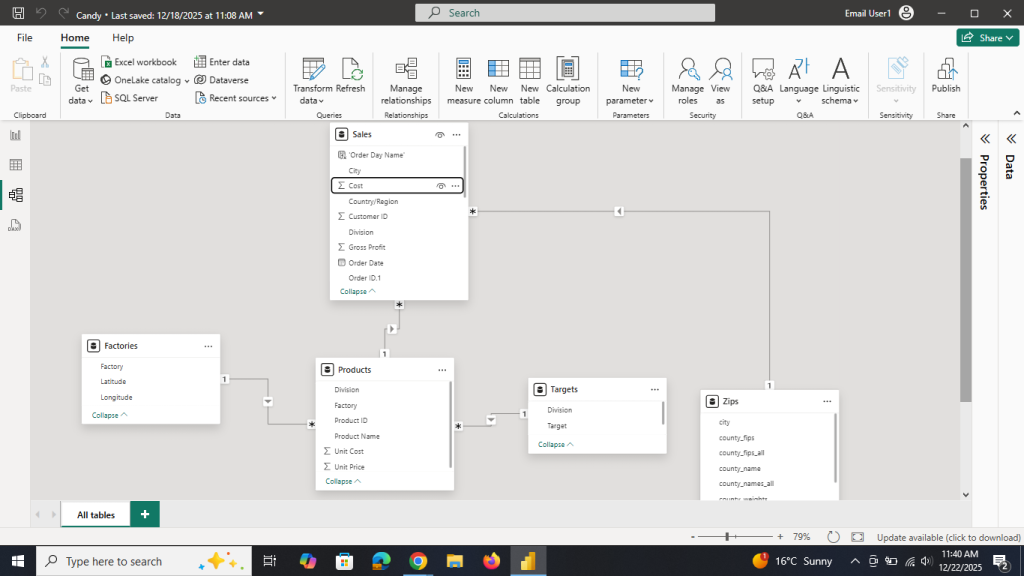
Some key points I learned in data modeling
- Direction should be from the dimension tables to the fact table.
- Fact table should place at bottom center and dimension should be above fact table.
- And there isn’t necessary that all dimension tables should be connected.
Key DAX Measures I Created
To support analysis, I created the following core measures:
Total Sales = SUM(Candy_Sales[Sales])
Total Cost = SUM(Candy_Sales[Cost])
Gross Profit = SUM(Candy_Sales[Gross Profit])
Profit Margin = DIVIDE([Gross Profit], [Total Sales])
Target Achievement % =
DIVIDE([Total Sales], SUM(Candy_Targets[Target])).
Report Structure
I aligned the report with my learning objective (linked internally in the report) and structured it into two pages:
- Page 1: Product and market analysis
- Page 2: Factory, orders, and shipment analysis
The dataset covers four years of data.
While the visuals show cumulative insights, I added a year slicer so any individual year can be analyzed separately.
Page 1: Product & Market Analysis
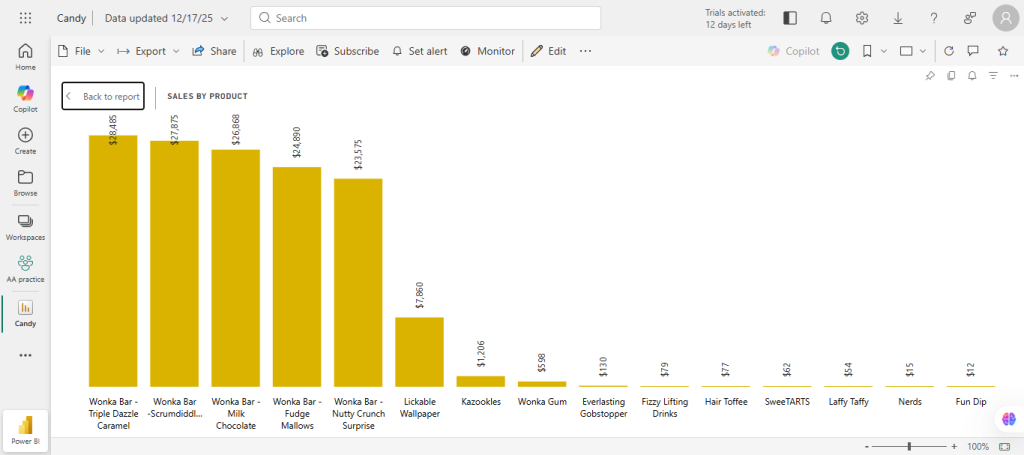
Product Sales
Wonka Bar is the strongest brand overall. It has six products, out of which five are top-selling.
Top 3 selling products:
- Wonka Bar – Triple Dazzle Caramel
- Wonka Bar – Scrumdidlyumptious
- Wonka Bar – Milk Chocolate
Least selling products:
- Laffy Taffy
- Nerds
- Fun Dip
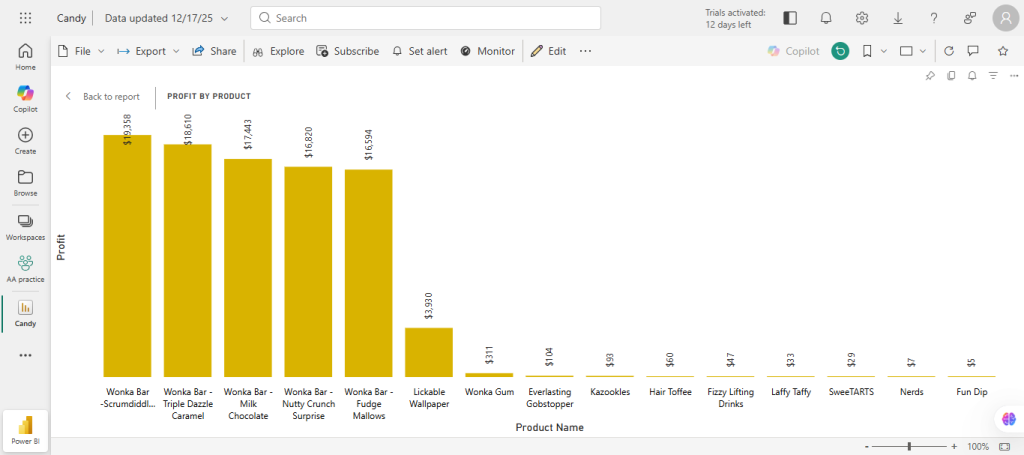
Product Profitability
Sales volume and profitability mostly align.
Top 3 most profitable products:
- Wonka Bar – Scrumdidlyumptious
- Wonka Bar – Triple Dazzle Caramel
- Wonka Bar – Milk Chocolate
Least profitable products:
- SweeTarts
- Nerds
- Fun Dip
This shows that the best-selling products are also the most profitable, making them clear business priorities.
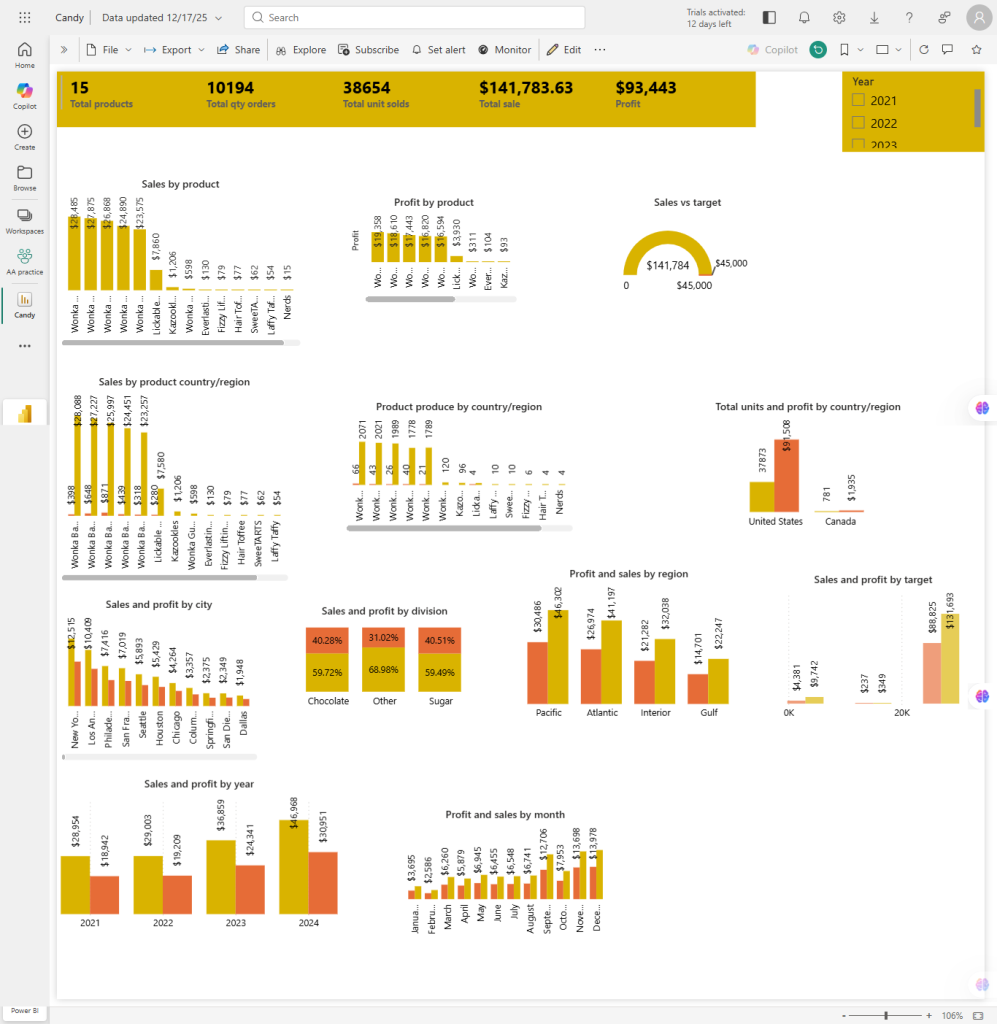
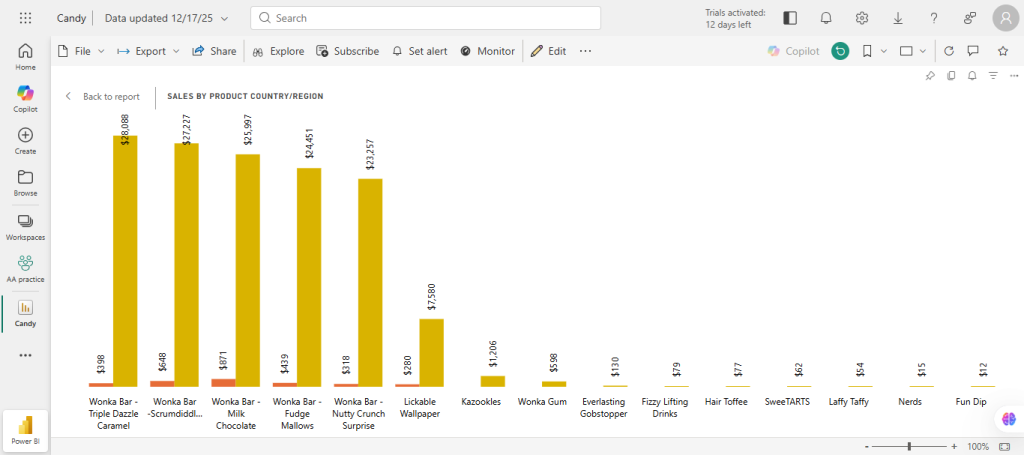
Sales by Product and Country
The company has 15 total products.
- The USA produces all 15 products
- Canada produces only 6 products
Despite this difference, the same three Wonka Bar products dominate sales in both countries:
- Triple Dazzle Caramel
- Milk Chocolate
- Scrumdidlyumptious
Least selling products in the USA:
- Laffy Taffy
- Nerds
- Fun Dip
Units Sold & Profit by Country
- USA: 37,873 units sold, $91,508 profit
- Canada: 781 units sold, $1,935 profit
The US clearly dominates both in scale and profitability.

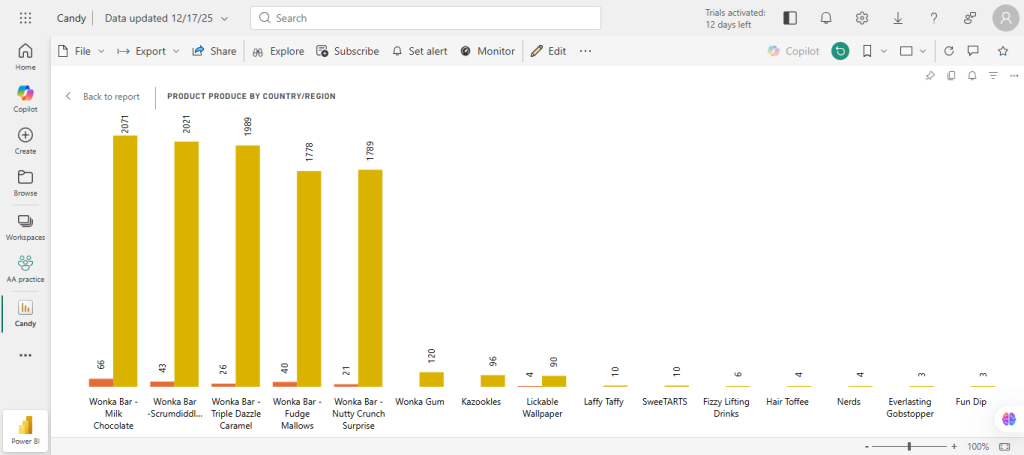
Products Produced by Country
Most produced products (both countries):
- Wonka Bar – Milk Chocolate
- Wonka Bar – Scrumdidlyumptious
- Wonka Bar – Triple Dazzle Caramel
Least produced in the USA:
- Nerds
- Everlasting Gobstopper
- Fun Dip
Least produced in Canada:
- Wonka Bar – Fudge Mallows
- Wonka Bar – Nutty Crunch Surprise
- Lickable Wallpaper
City-Level Insights
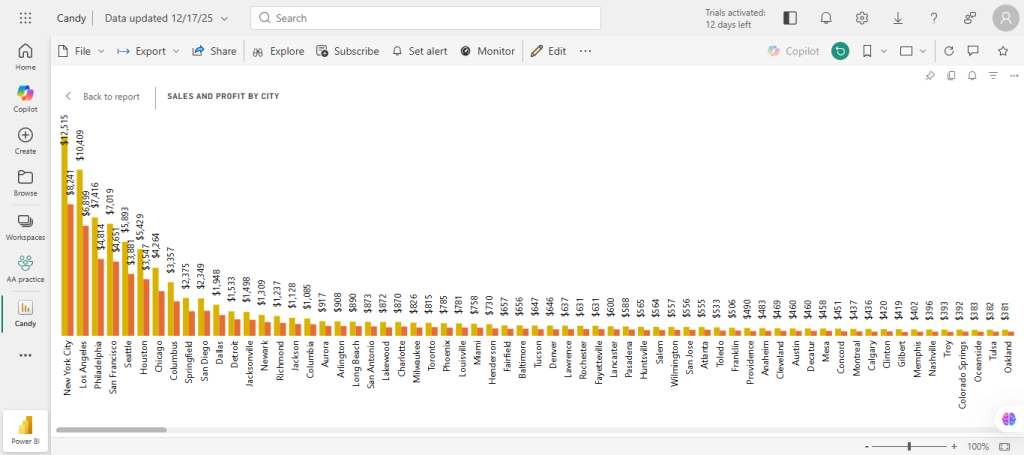
Candies are sold in 10,194 cities.
- New York, Los Angeles, and Philadelphia are both the highest-selling and most profitable cities.
- These cities appear consistently across sales, profit, and order visuals.
Sales & Profit by Division
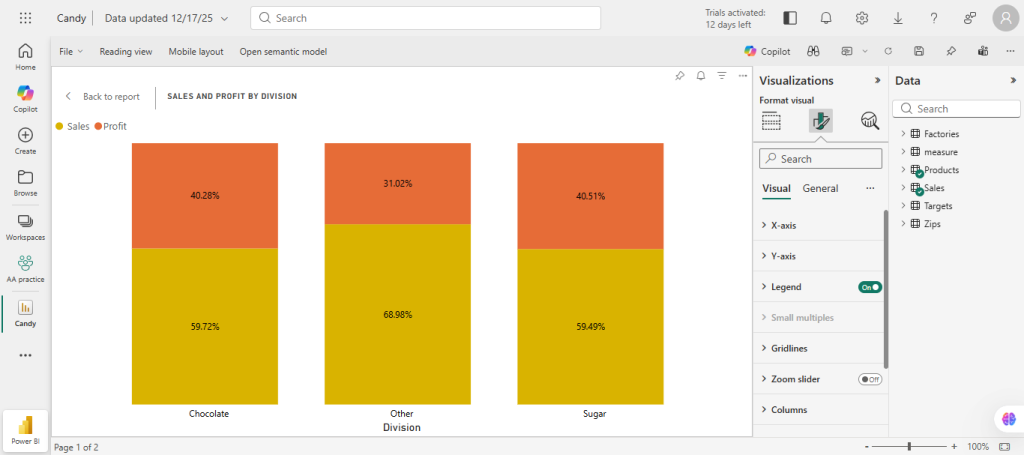
An interesting contrast appears here:
- Other Chocolate has the highest sales but lowest profitability
- Sugar has the lowest sales but highest profitability
This inverse relationship suggests pricing or cost structure differences between divisions.
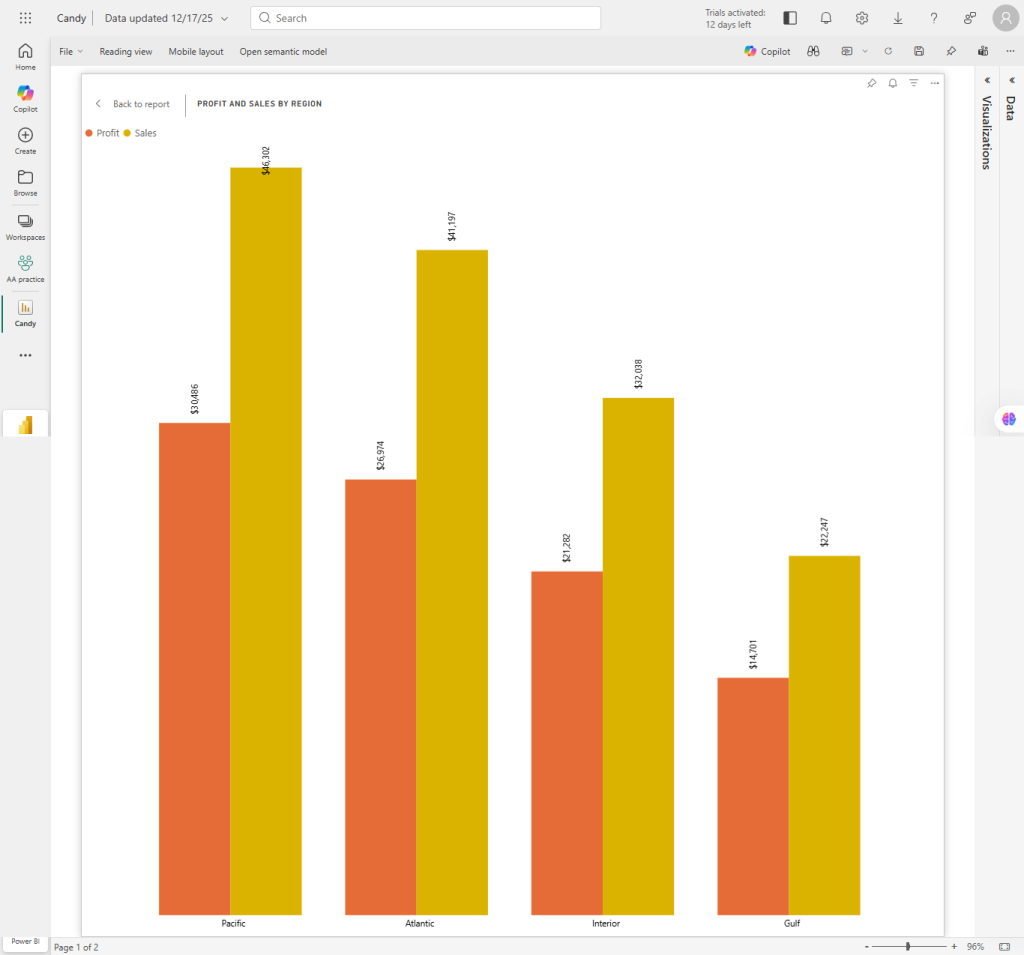
Regional Performance
- Pacific is the most profitable and highest-selling region
- Gulf has the lowest sales and profit
Time-Based Trends
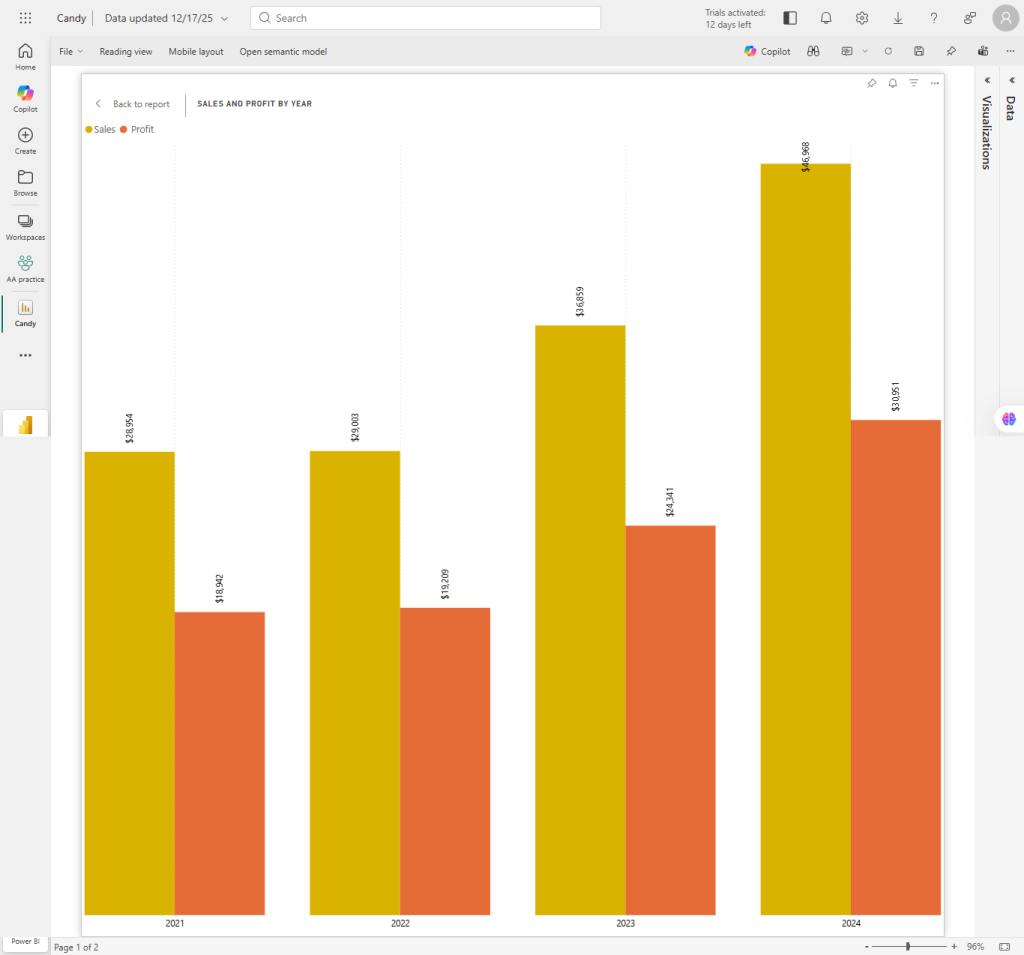
By year:
- 2021 has the lowest sales and profit
- 2024 has the highest sales and profit
- Sales and profit increase steadily each year
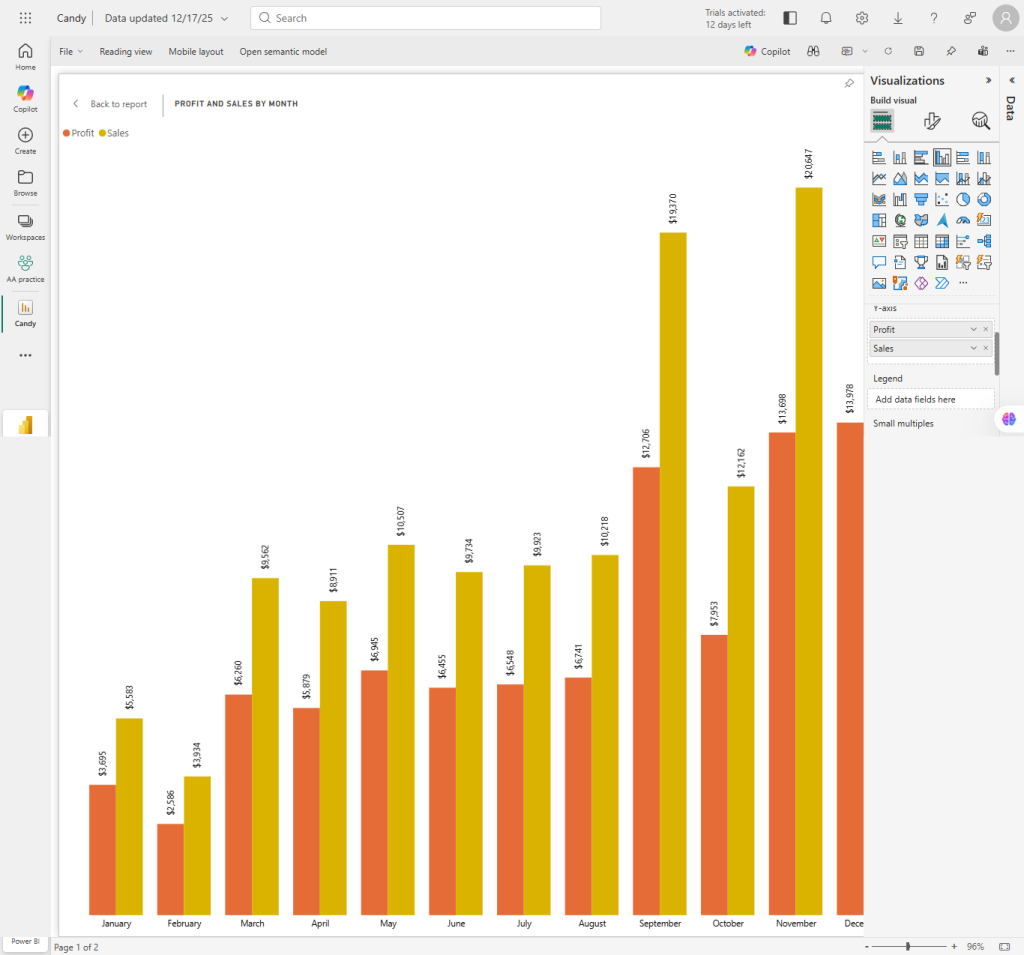
By month:
- November has the highest sales and profit in 2021, 2022, and 2024
- December leads in 2023
- February consistently has the lowest sales and profit across all years
Overall, December performs best, while February performs worst.
Page 2: Factory & Order Analysis
Factory Overview
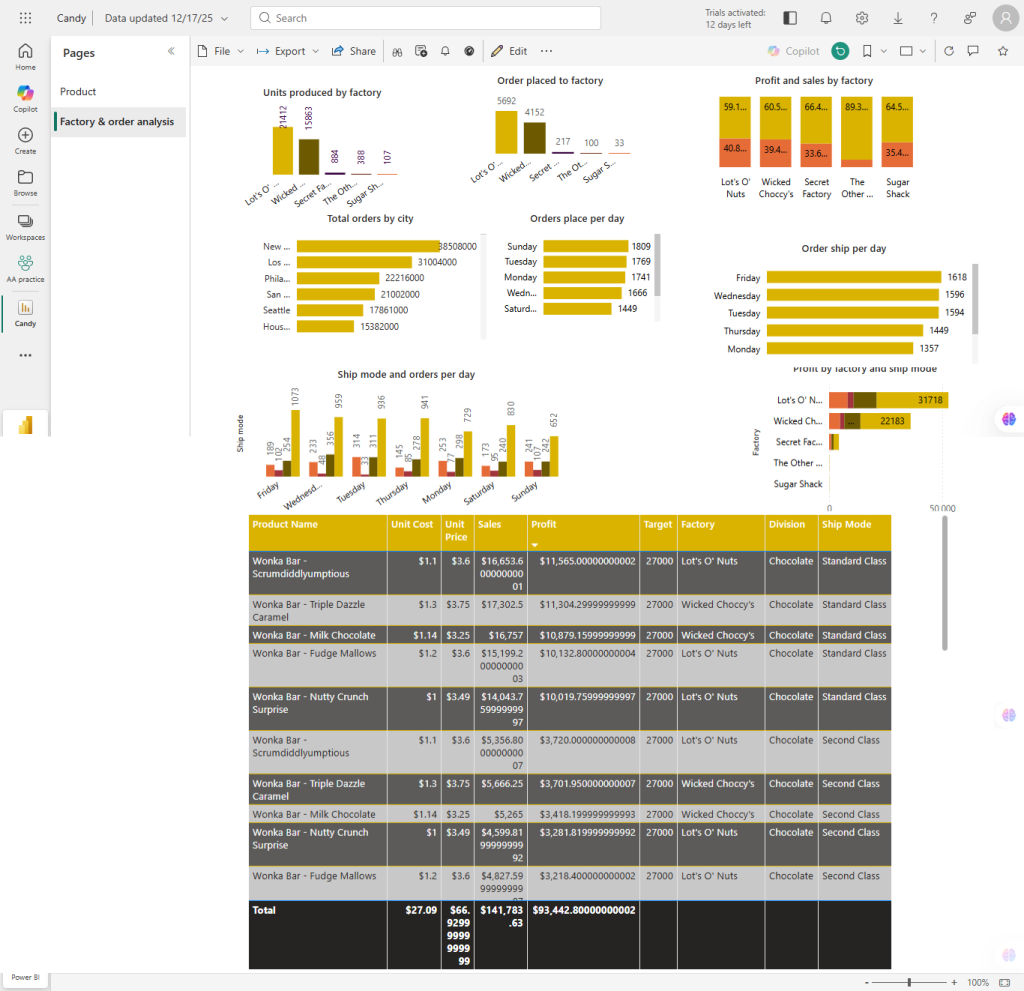
There are five factories:
- Sugar Shack – 5 products
- Lotus O Nuts – 3 products
- Secret Factory – 3 products
- The Other Factory – 2 products
- Wicked Choco’s – 2 products
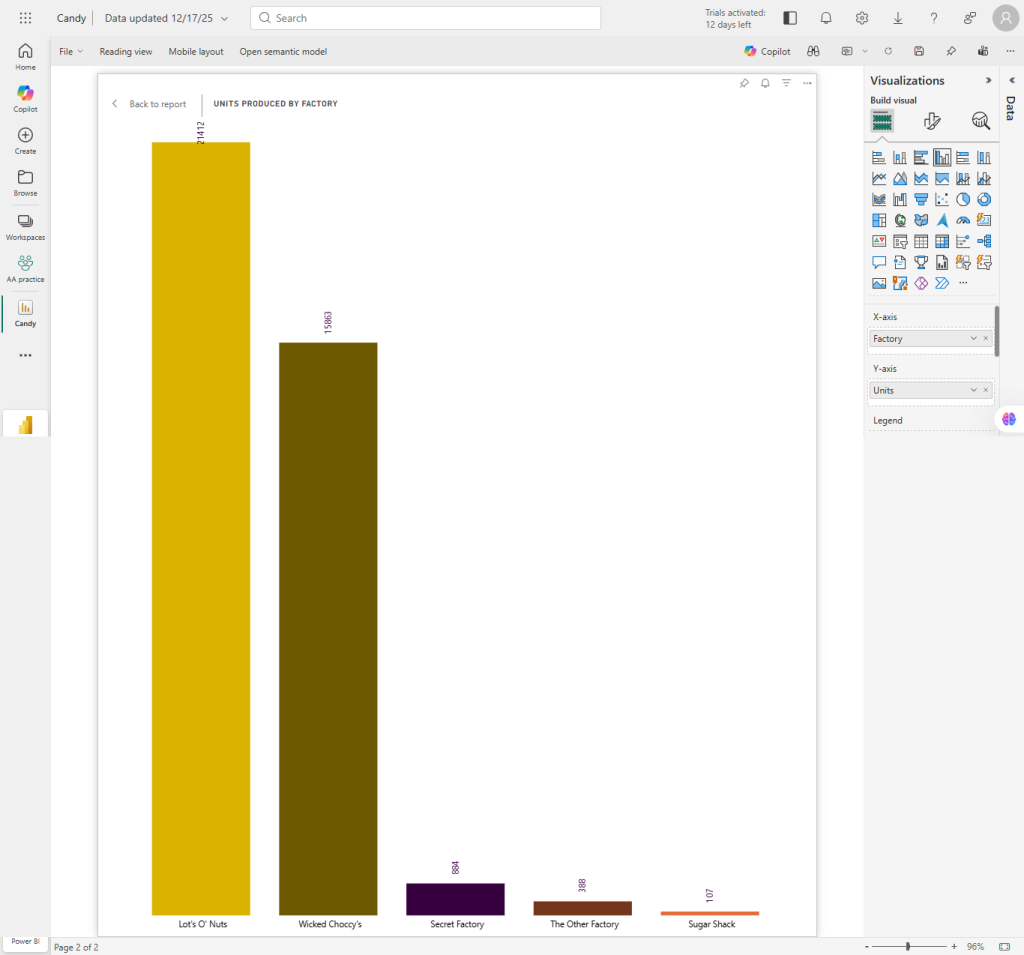
Units Sold by Factory
- Lotus O Nuts sold the most units
- Sugar Shack, despite having the most products, sold the fewest units
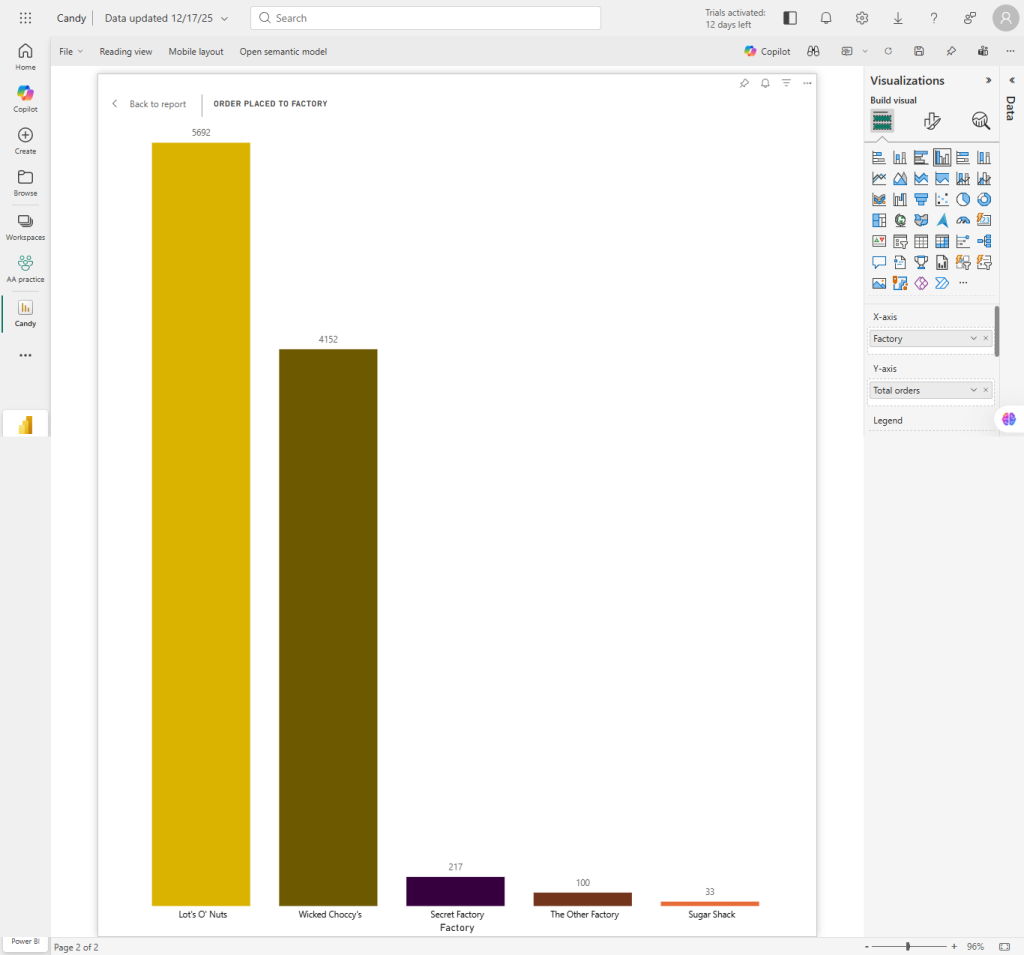
Orders by Factory
- Most orders are placed to Lotus O Nuts
- Sugar Shack receives the fewest orders
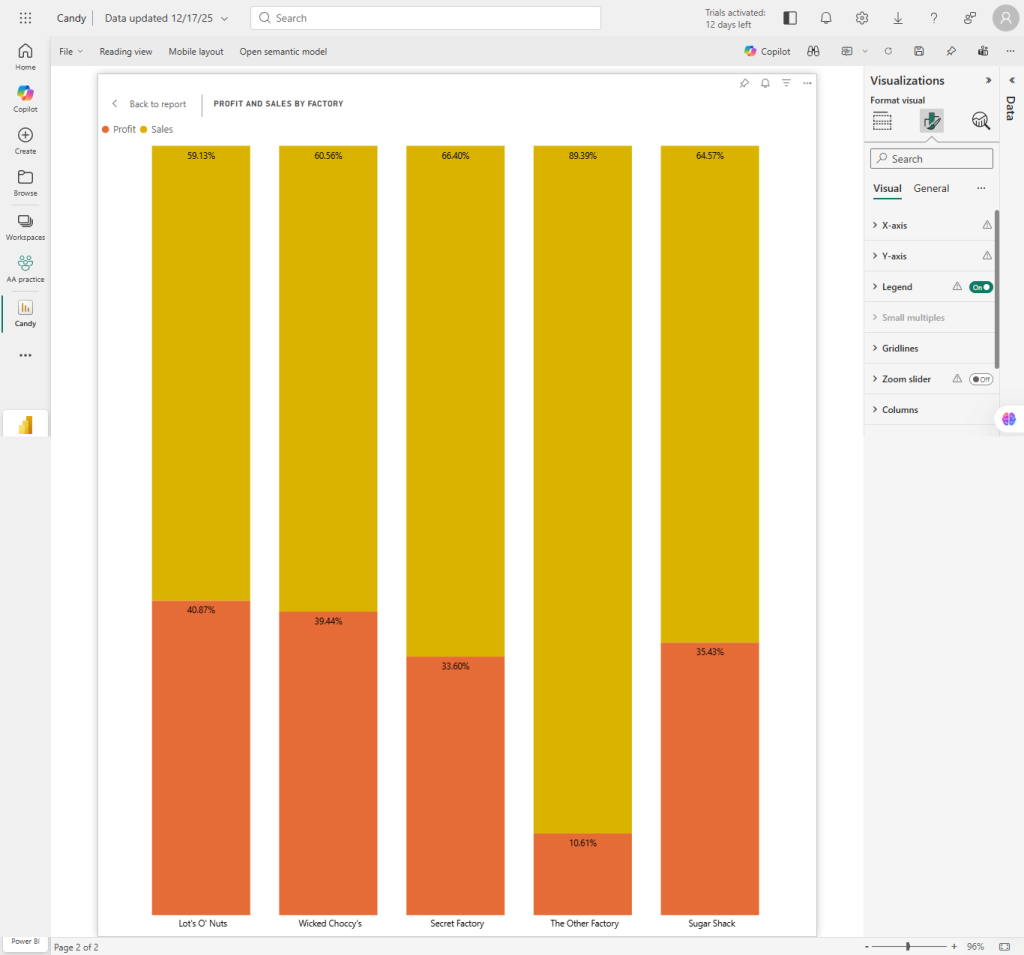
Sales & Profit by Factory
- Lotus O Nuts leads in both sales and profit
- Sugar Shack has the lowest sales and profit
This indicates that having more products does not guarantee better performance.
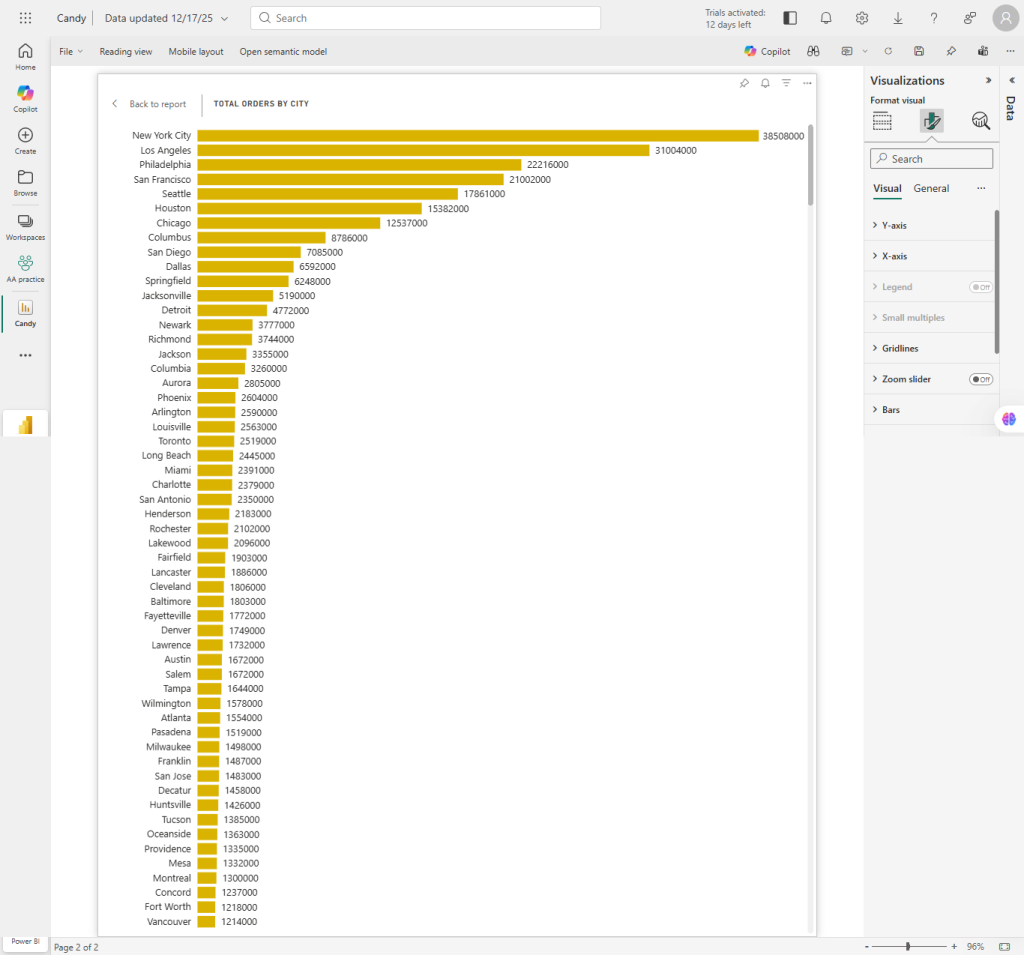
Orders by City
- New York, Los Angeles, and Philadelphia receive the most orders
- Yucaipa receives the fewest orders
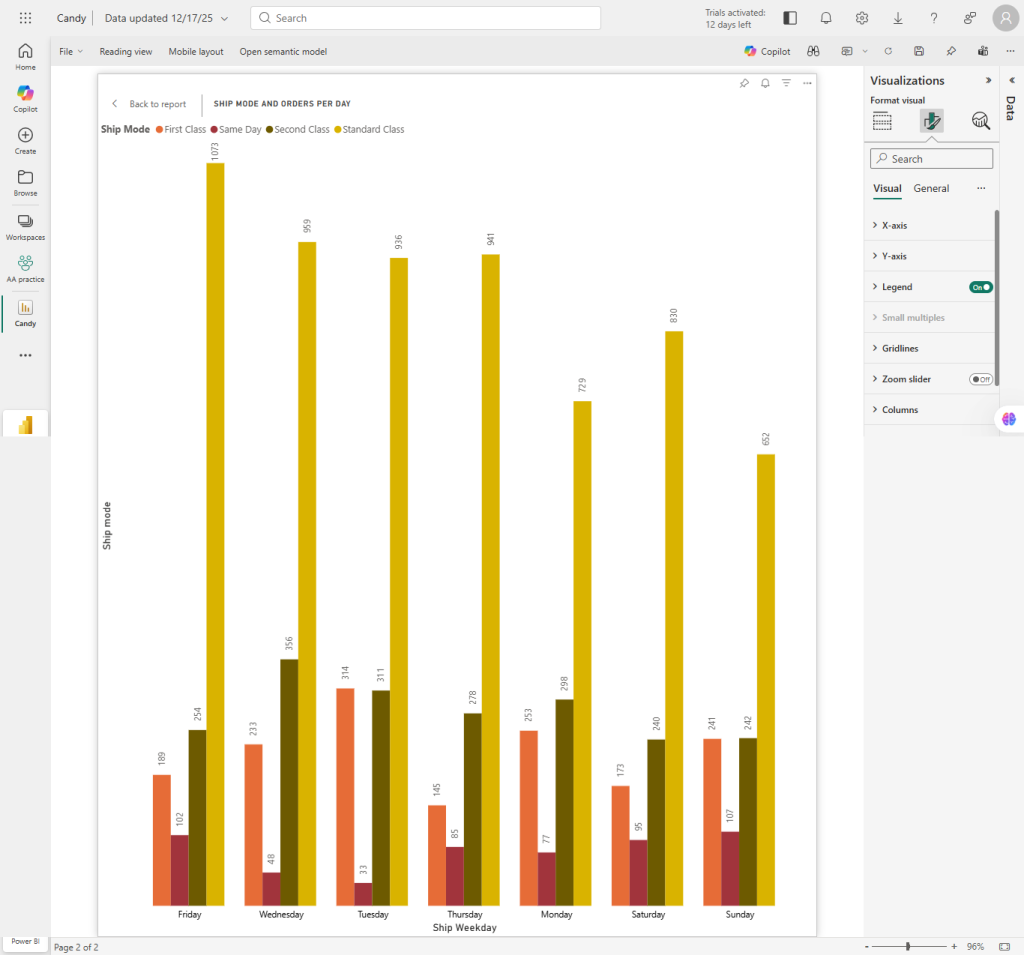
Orders & Shipping Patterns
- Most orders placed: Sunday and Tuesday
- Least orders placed: Friday

Shipping
- Most shipments: Friday and Wednesday
- Least shipments: Sunday

Shipping Modes
There are four shipping modes.
- Standard Class is consistently the most used across all days
- Other shipping modes fluctuate throughout the week
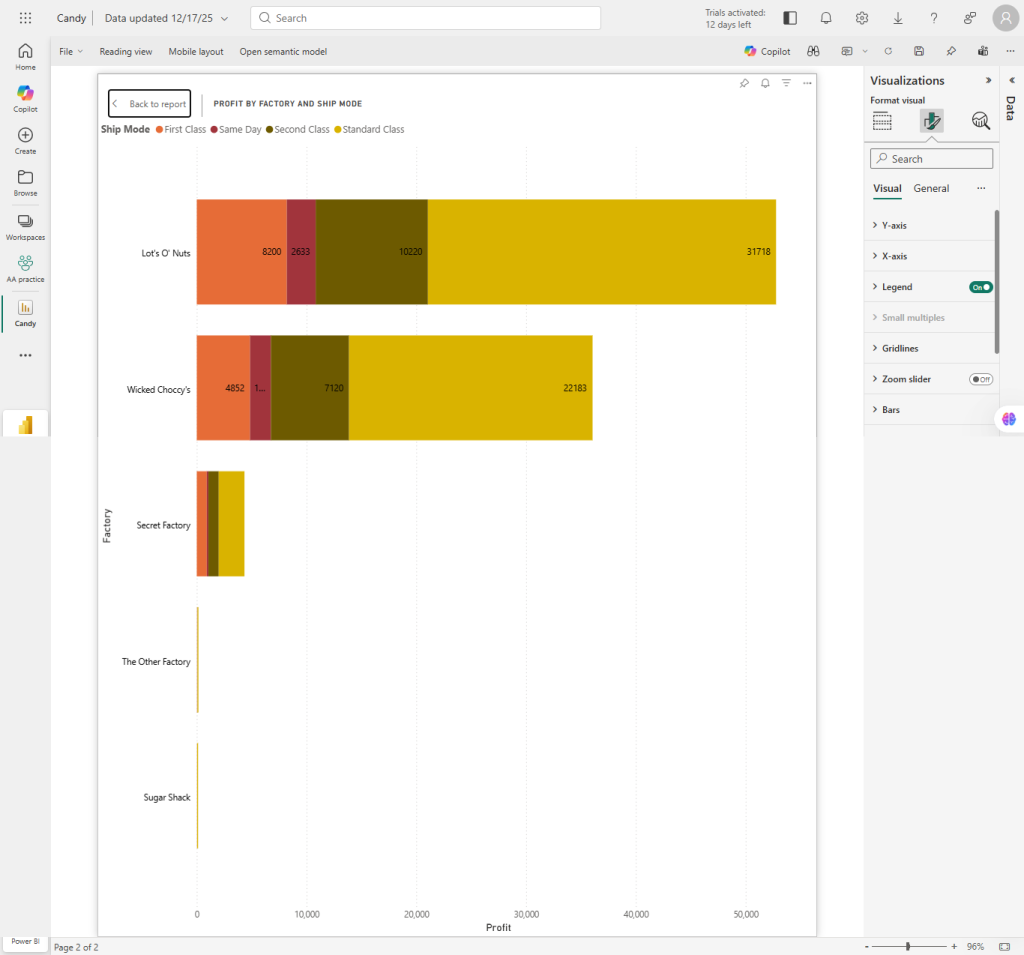
Profit by Factory and Shipping Mode
- Standard Class generates the highest profit and is used by all factories
- First Class has the lowest profit
Key Insights Summary
- A small group of products drives most business value.
Three Wonka Bar products consistently lead in both sales and profit, indicating a strong dependence on a limited product portfolio. Prioritizing these products offers the fastest path to revenue and profit growth. - High sales volume does not always mean high profitability.
The “Other Chocolate” division generates the most sales but delivers the lowest profit, while the Sugar division shows the opposite trend. This highlights the importance of margin-focused decision-making rather than volume alone. - The US dominates scale, while Canada shows selective efficiency.
The USA leads in units sold and profit, but Canada achieves profitability with a much smaller product range. This suggests opportunities for controlled product expansion in Canada. - More products do not guarantee better factory performance.
Sugar Shack manages the highest number of products yet underperforms in sales and profit. In contrast, Lotus O Nuts delivers the strongest results with fewer products, indicating better operational or demand alignment. - Sales and profit show clear seasonal and time-based patterns.
Performance improves consistently year over year, peaks in November and December, and drops sharply in February. These trends can support better planning for promotions, inventory, and cost control. - Orders and shipping behavior are predictable.
Orders concentrate on specific days, while Standard Class shipping generates the highest profit across all factories. This predictability can help optimize staffing, logistics, and shipping strategies.
